Exam 1: Organizing and Visualizing Numeric Data
Exam 1: Organizing and Visualizing Numeric Data318 Questions
Exam 2: Making Sense of It All140 Questions
Exam 3: Thinking Linearly71 Questions
Exam 4: Living in a Nonlinear World156 Questions
Select questions type
The figure represents the results of a survey on favorite foods. 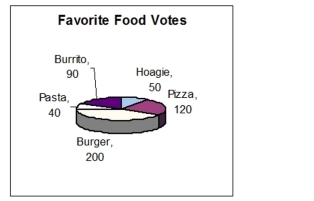 What percent of the votes were for hoagies?
(Multiple Choice)
4.7/5  (41)
(41)
A used car dealership sells several makes of vehicles. Refer to the graph. Round the answers to the nearest whole unit. 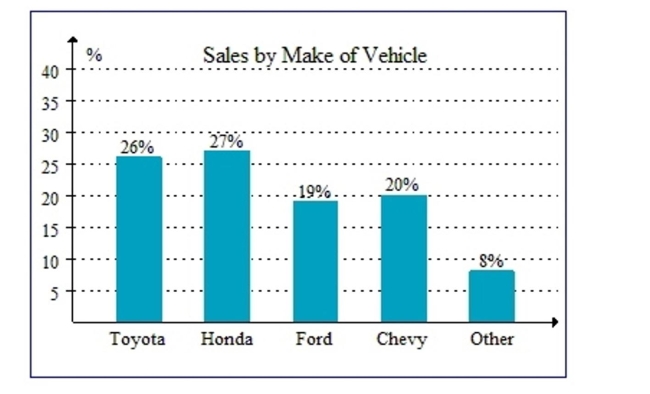 If the dealership sold 171 vehicles in 1 month, how many were Chevys?
(Multiple Choice)
4.8/5 (35)
The table provided gives the expenses for one semester at college. 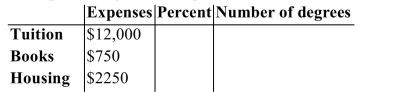 Construct a circle graph to display the college expenses. Label the graph with percents.
(Essay)
4.8/5 (35)
Subtract. Write the answer as a fraction in lowest terms or as an integer. 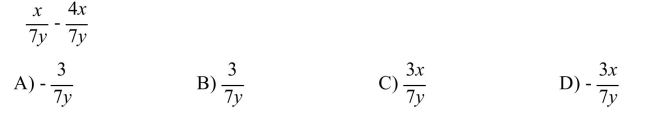
(Short Answer)
4.8/5 (31)
The figure represents the results of a survey on favorite foods. 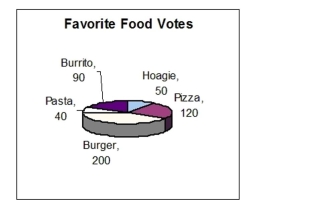 Compare the number of votes for burgers and hoagies.
(Multiple Choice)
4.7/5 (36)
In a recent survey 38% of the people in the U.S. say that gas prices have affected the type of vehicle they will buy. In a sample of 400 people who are in the market for a new vehicle, how many would you expect to be influenced by gas prices?
(Multiple Choice)
4.8/5 (38)
Travis wrote five checks to the employees of his business, each for $420. If the original balance in his checking account was $1635, what was the new balance?
(Multiple Choice)
5.0/5 (33)
Filters
- Essay(0)
- Multiple Choice(0)
- Short Answer(0)
- True False(0)
- Matching(0)