Exam 1: Organizing and Visualizing Numeric Data
Exam 1: Organizing and Visualizing Numeric Data318 Questions
Exam 2: Making Sense of It All140 Questions
Exam 3: Thinking Linearly71 Questions
Exam 4: Living in a Nonlinear World156 Questions
Select questions type
Label the angle as an obtuse angle, acute angle, right angle, or straight angle. 
(Short Answer)
4.8/5  (41)
(41)
Consider this bar graph found in an advertisement for a performance supplement. Compare it to the
second bar graph, which represents the same data. 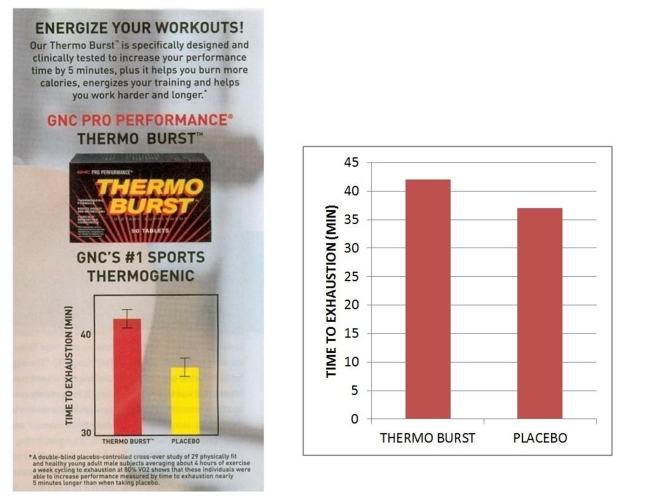 a. Estimate the average time to exhaustion using Thermo Burst.
b. Estimate the average time to exhaustion for those taking the placebo.
c. Why do the graphs look so different? Explain how the graph on the left might be used to mislead the reader.
a. Estimate the average time to exhaustion using Thermo Burst.
b. Estimate the average time to exhaustion for those taking the placebo.
c. Why do the graphs look so different? Explain how the graph on the left might be used to mislead the reader.
(Essay)
4.8/5 (33)
Find the simple interest and the total amount including interest. 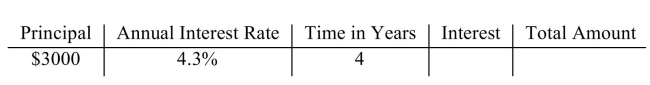
(Short Answer)
4.9/5 (27)
The table gives the scores for the top two finishers at a recent golf tournament. 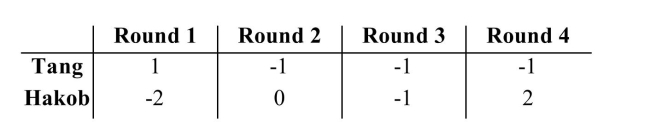 Compute Tang's total score.
(Multiple Choice)
4.8/5 (35)
The figure represents the results of a survey on favorite foods. 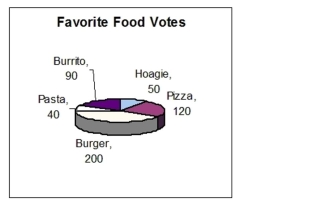 How many times more votes were there for pizza as for hoagies?
(Essay)
4.9/5 (35)
Write an exponential expression with 5 as the base and 3 as the exponent. 
(Short Answer)
5.0/5 (29)
A company did a poll of how their 800 employees commuted to work. The results are shown in
(Short Answer)
4.9/5 (36)
A sofa has a wholesale price of $650. A furniture store's markup rate is 40%.
a. What is the markup for this sofa?
b. What is the retail price?
c. If the Smiths buy this sofa including a 7% sales tax, how much will they pay?
(Essay)
4.8/5 (32)
Translate to a mathematical expression. Then simplify the expression. -6 added to the sum of -9 and 7
(Multiple Choice)
4.8/5 (30)
Filters
- Essay(0)
- Multiple Choice(0)
- Short Answer(0)
- True False(0)
- Matching(0)