Exam 9: Correlation and Regression
Exam 1: Introduction to Statistics36 Questions
Exam 2: Describing, Exploring, and Comparing Data40 Questions
Exam 3: Probability40 Questions
Exam 4: Discrete Probability Distributions38 Questions
Exam 5: Normal Probability Distributions38 Questions
Exam 6: Estimates and Sample Sizes With One Sample29 Questions
Exam 7: Hypothesis Testing With One Sample39 Questions
Exam 8: Inferences From Two Samples31 Questions
Exam 9: Correlation and Regression25 Questions
Exam 10: Multinomial Experiments and Contingency Tables40 Questions
Exam 11: Analysis of Variance40 Questions
Exam 12: Nonparametric Statistics40 Questions
Exam 13: Life Tables40 Questions
Select questions type
Use the following sample data for the next three questions. Assume the sample of paired (x, y) data is a random sample.
 -Use a significance level of .05 to determine whether there is a significant linear correlation between the two variables.
(Essay)
4.8/5  (32)
(32)
For the next questions, identify the choice that contains a conclusion with a
common correlation error.
-Given: There is a significant linear correlation between cordgrass monitored for survival on the left bank of a creek and cordgrass monitored for survival on the right bank of a creek.
(Multiple Choice)
4.7/5 (40)
Use the following display for the next questions. The display is based on
sample annual data relating to the ozone layer monitoring at Halley Station in
Antarctica. The dependent variable is the year. The independent variables are as
follows: the level of ozone in Dobson units (DU), the global temperature (Temp, in
°C ), and the United States chlorofluorocarbon (CFC) gases production (in
thousands of metric tons).
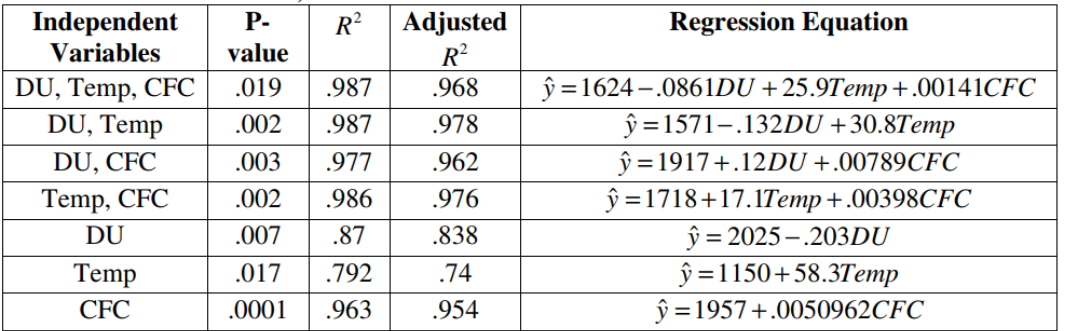 -Identify the multiple regression equation that expresses the year in terms of ozone level, global temperature, and US production of CFCs.
(Essay)
4.9/5 (36)
For the next questions, identify the choice that contains a conclusion with a common correlation error.
-Use a significance level of .05 to determine whether there is a significant linear correlation between the two variables.
(Essay)
4.8/5 (37)
Use the following sample data to answer the next questions. The paired data
consist of the cost of regionally advertising (in thousands of dollars) a certain
pharmaceutical drug and the number of new prescriptions written (in thousands).
 -Find the predicted value of the number of new prescriptions written if $7000 is spent in regional advertising.
(Short Answer)
4.9/5 (37)
Filters
- Essay(0)
- Multiple Choice(0)
- Short Answer(0)
- True False(0)
- Matching(0)