Exam 2: Describing, Exploring, and Comparing Data
Exam 1: Introduction to Statistics36 Questions
Exam 2: Describing, Exploring, and Comparing Data40 Questions
Exam 3: Probability40 Questions
Exam 4: Discrete Probability Distributions38 Questions
Exam 5: Normal Probability Distributions38 Questions
Exam 6: Estimates and Sample Sizes With One Sample29 Questions
Exam 7: Hypothesis Testing With One Sample39 Questions
Exam 8: Inferences From Two Samples31 Questions
Exam 9: Correlation and Regression25 Questions
Exam 10: Multinomial Experiments and Contingency Tables40 Questions
Exam 11: Analysis of Variance40 Questions
Exam 12: Nonparametric Statistics40 Questions
Exam 13: Life Tables40 Questions
Select questions type
If a relative frequency distribution were constructed for the width of the channels, what would be the relative frequency for the class with a width of 20-24m?
(Multiple Choice)
4.7/5  (27)
(27)
Use the frequency distribution to answer the next questions. A sample of 80
juvenile salmon is grouped into the resulting frequency distribution based on their
weights. 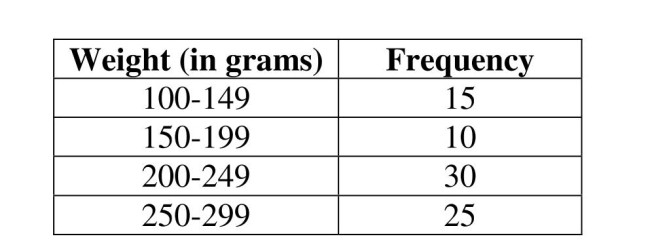 -Determine the sample mean of the weights of the juvenile salmon summarized in the frequency distribution.
(Short Answer)
4.9/5 (34)
If a Pie Chart were constructed for the weights of the salmon, what would be the measure of the central angle for the class weighing 200-249 grams?
(Multiple Choice)
4.7/5 (37)
Use the following sample data for the next questions. A study of the
percentage of alcohol content of nine randomly selected expensive beers yielded
the following data:  -Construct a stem and leaf plot of the beers' percentage of alcohol content.
(Essay)
5.0/5 (36)
Use the following sample data for the next questions. A study of the
percentage of alcohol content of nine randomly selected expensive beers yielded
the following data:
-Find the percentile corresponding to 9% alcohol.
(Short Answer)
4.8/5 (31)
Use the frequency distribution to answer the next questions. A sample of 272
log jams found in river channels in the Northwest U.S. is grouped into the resulting
frequency distribution based on the width of the channel in which the log jams
were found. 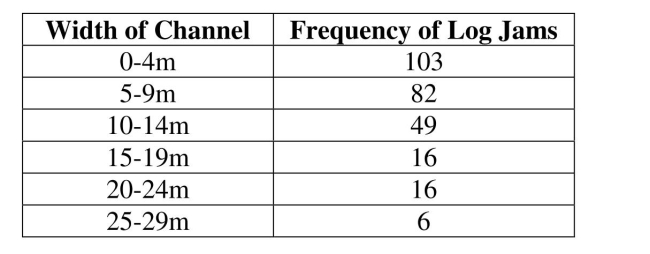 -Identify the class width, the class midpoints, and the class boundaries.
(Essay)
4.9/5 (33)
The distribution of the histogram for the weights of the juvenile salmon appears:
(Multiple Choice)
4.7/5 (30)
Use the frequency distribution to answer the next questions. A sample of 80
juvenile salmon is grouped into the resulting frequency distribution based on their
weights.
-Identify the class width, the class midpoints, and the class boundaries.
(Essay)
4.7/5 (33)
Use the following sample data for the following questions. A study of physical
fitness tests for 12 randomly selected Pre-Medical students measured their exercise
capacity (in minutes). The following data resulted:
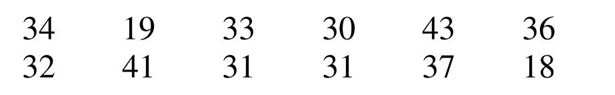 -Construct a box plot for the students' exercise capacity.
(Essay)
4.8/5 (35)
Use the following sample data for the next questions. A study of the
percentage of alcohol content of nine randomly selected expensive beers yielded
the following data:
-Find the standard deviation and the variance for the sample data of the beers' percentage of alcohol content.
(Short Answer)
5.0/5 (32)
Use the following sample data for the next questions. A study of the
percentage of alcohol content of nine randomly selected expensive beers yielded
the following data:
-Using four classes, construct a frequency distribution of the beers' percentage of alcohol content.
(Essay)
4.9/5 (30)
Use the following sample data for the following questions. A study of physical
fitness tests for 12 randomly selected Pre-Medical students measured their exercise
capacity (in minutes). The following data resulted:
-Find the standard deviation and the variance for the sample data of the students' exercise capacity.
(Short Answer)
4.7/5 (31)
If a cumulative frequency distribution were constructed for the width of the channels, what would be the cumulative frequency for the class width less than 10m?
(Multiple Choice)
4.8/5 (28)
Use the frequency distribution to answer the next questions. A sample of 272
log jams found in river channels in the Northwest U.S. is grouped into the resulting
frequency distribution based on the width of the channel in which the log jams
were found.
-Construct a corresponding histogram for the width of the channels.
(Essay)
4.8/5 (32)
If a relative frequency distribution were constructed for the weights of the salmon, what would be the relative frequency for the class weighing 150-199 grams?
(Multiple Choice)
4.9/5 (33)
Use the following data for the next questions. Dental researchers found that a
sample of females scored the following on the Dental Hygiene Fear Survey:
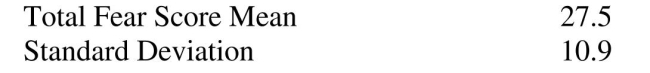 -Use the Range Rule of Thumb to estimate the minimum and maximum "usual" total fear score for females.
(Essay)
4.9/5 (27)
Use the following sample data for the following questions. A study of physical
fitness tests for 12 randomly selected Pre-Medical students measured their exercise
capacity (in minutes). The following data resulted:
-Find the sample data value corresponding to P24 .
(Short Answer)
4.7/5 (30)
Use the frequency distribution to answer the next questions. A sample of 272
log jams found in river channels in the Northwest U.S. is grouped into the resulting
frequency distribution based on the width of the channel in which the log jams
were found.
-Find the sample standard deviation of the width of the channels summarized in the frequency distribution.
(Short Answer)
4.9/5 (40)
Use the following data for the next questions. Dental researchers found that a
sample of females scored the following on the Dental Hygiene Fear Survey:
-Convert a total fear score of 10 to a z-score.
(Short Answer)
4.8/5 (41)
Use the following sample data for the following questions. A study of physical
fitness tests for 12 randomly selected Pre-Medical students measured their exercise
capacity (in minutes). The following data resulted:
-Construct a stem and leaf plot of the students' exercise capacity.
(Essay)
4.8/5 (33)
Filters
- Essay(0)
- Multiple Choice(0)
- Short Answer(0)
- True False(0)
- Matching(0)