Exam 3: Numerical Methods for
Exam 1: Collecting Data in Reasonable Ways44 Questions
Exam 2: Graphical Methods for31 Questions
Exam 3: Numerical Methods for31 Questions
Exam 4: Describing Bivariate Numerical Data29 Questions
Exam 5: Probability29 Questions
Exam 6: Random Variables and18 Questions
Exam 7: Selecting an Appropriate Method4 Questions
Exam 8: Sampling Variability Sampling21 Questions
Exam 9: Estimation Using a Single Sample29 Questions
Exam 10: Asking and Answering Questions About a Population Proportion36 Questions
Exam 11: Asking and Answering Questions About the Difference Between Two Population Proportions16 Questions
Exam 12: Asking and Answering Questions About a Population Mean33 Questions
Exam 13: Asking and Answering Questions About the Difference Between Two Means27 Questions
Exam 14: Learning From Experiment Data8 Questions
Exam 15: Learning From Categorical Data22 Questions
Exam 16: Understanding Relationships Numerical12 Questions
Select questions type
The measurements in the table at right are from coins mintedthat different mints reveal themselves in different traceelement profiles in the coins. Atomic AbsorptionSpectrometry was used to estimate the % by weight of gold;these data are presented here.
(a) Construct a box plot for these data.in Rome during first three centuries AD. Historians believe 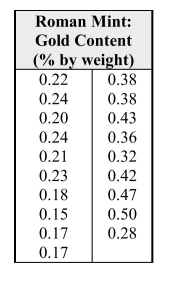 (b) Would you say this distribution is skewed or approximately symmetric?
Justifyyour response using appropriate statistical terminology.
(b) Would you say this distribution is skewed or approximately symmetric?
Justifyyour response using appropriate statistical terminology.
(Essay)
4.7/5  (26)
(26)
The Economist is a weekly newspaper that focuses onyear the "Big Mac Index," the price ($ U. S.) of a BigMac in countries around the world, is published as alight-hearted way of comparing currencies. The valuesfor 19 countries are displayed at right. ($3.41 was theU.S. price at publication in the summer of 2007.)international politics, business news, and opinion. Each 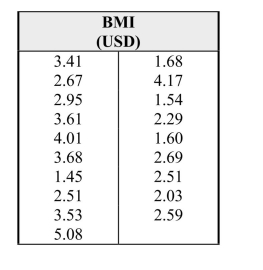 (a) Construct a box plot for these data.
(b) Would you say this distribution is skewed or approximately symmetric?
Justifyyour response using appropriate statistical terminology.
(a) Construct a box plot for these data.
(b) Would you say this distribution is skewed or approximately symmetric?
Justifyyour response using appropriate statistical terminology.
(Essay)
4.9/5 (39)
The table below presents some summary statistics from the distributions of the number of drones.
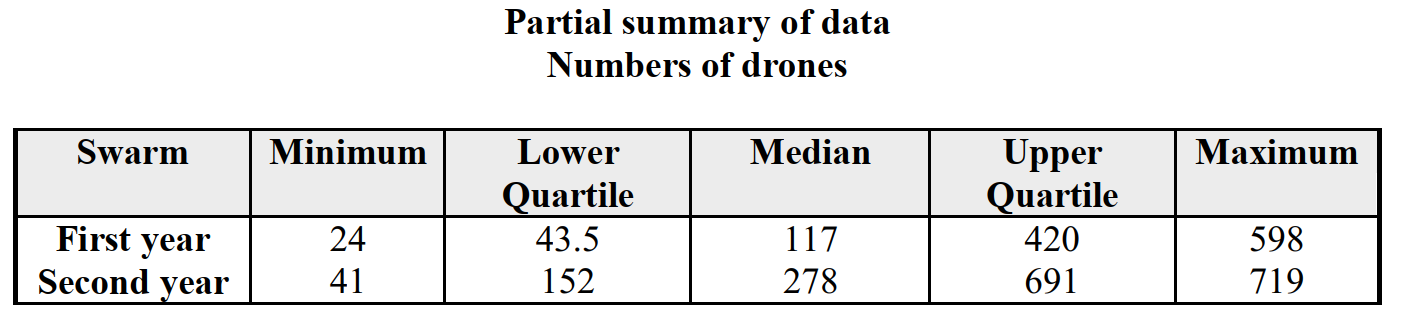 -Construct comparative box plots of the numbers of drones in the swarms in thefirst and second years.
(Essay)
4.8/5 (31)
Grey Kangaroos are large social marsupials, indigenous to Australia. As part of astudy of these creatures, biologists measured various aspects of their skeletalstructure. Data on palate width from a sample of 124 grey kangaroos are presented inthe stem-and-leaf display below. The display uses five lines for each stem. Thus,"2t|" is the stem for palate widths of 22 and 23, "2f|" for 24 and 25, "2s|" for 26 and27, and so on. (The "t" then stands for leaves that are twos and threes, the "f" forleaves of fours and fives, etc. "2." Indicates leaves that are zeros and ones; "2*"indicates leaves that are eights and nines.)The mean palate width of this sample is 2.6cm, and the standard deviation is 0.3 cm. 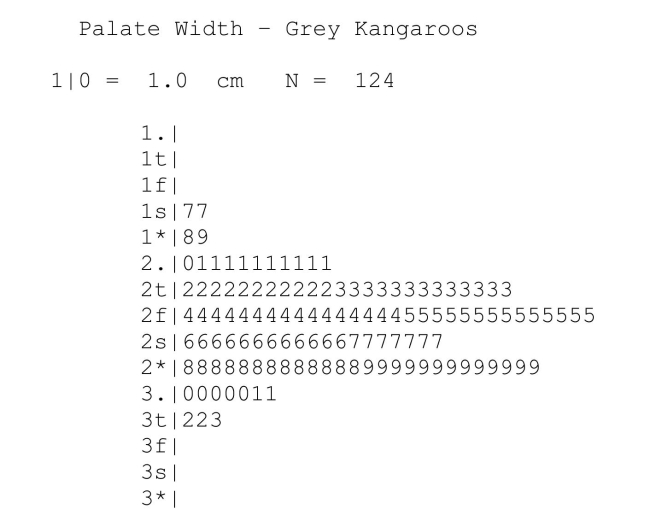 (a) Approximately what percent of palate widths in this sample exceed 2.9 cm?
(b) What is the approximate percentile of a palate width that is 2.0 cm?
(a) Approximately what percent of palate widths in this sample exceed 2.9 cm?
(b) What is the approximate percentile of a palate width that is 2.0 cm?
(Essay)
4.8/5 (29)
Multiple sclerosis (MS) is an autoimmune disease that affects the brain and spinal cord.
MS affects women more than men, and is most commonly diagnosed between the ages of 20 and 40. MS sufferers typically have problems of coordination and walking. The standard care for some sufferers is a plastic device affixed to the lower leg and ankle. In a recent test of this device, volunteers with MS were timed as they walked across a room.
Times, measured without the device (ND) and with the device (D), are presented below.
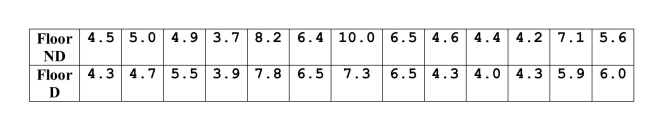 -Using appropriate statistical terminology, compare the center, shape, and spread oftimes on the walking task with and without the device.
(Essay)
4.8/5 (37)
Multiple sclerosis (MS) is an autoimmune disease that affects the brain and spinal cord.
MS affects women more than men, and is most commonly diagnosed between the ages of 20 and 40. MS sufferers typically have problems of coordination and walking. The standard care for some sufferers is a plastic device affixed to the lower leg and ankle. In a recent test of this device, volunteers with MS were timed as they walked across a room.
Times, measured without the device (ND) and with the device (D), are presented below.
-Calculate the values of these numerical summaries for the walking task without thedevice:a) The mean __________________b) The standard deviation ___________________c) The median ___________________d) The interquartile range ___________________
(Essay)
4.7/5 (37)
The forces that determine the size of groups (“swarms”) of social insects and the rates at which they grow are not well understood. Biologists have observed large variability in the size of swarms across species. In a study of the social wasp, Polybia occidentalis, investigators dismantled a nest of these insects and marked a few insects for future identification in new swarms. Twenty-five days after dismantling the original swarm they had located new swarms of wasps from the original colonies.
-Using your box plots 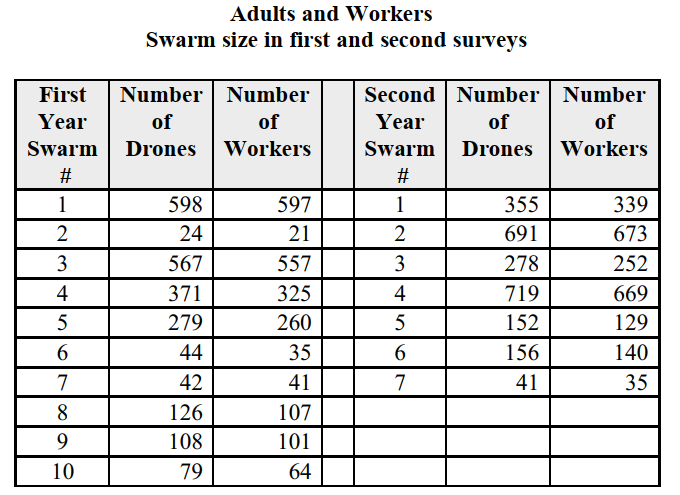 , compare the distributions of first and second yeardrones. Justify your comparisons by appealing to specific aspects of the box plotsconstructed in
(Essay)
4.8/5 (37)
Higher vertebrates (mammals and birds) exhibit lateralized behaviors, commonly referred to as “handedness.” Recently an investigator studied the coiling behavior of the Agkistrodon piscivorus leucostoma – more commonly known as the cottonmouth snake.
The cottonmouth is a venomous snake that spends much of its time in a coil, sometimes coiled in a counter-clockwise direction, other times in a clockwise direction. The investigator made many observations of coiling behavior, and calculated a “laterality index” for 30 cottonmouths. He defined the laterality index for each snake as the percentage of observations of the snake that were categorized as coils in the counterclockwise direction.
-Using your box plots 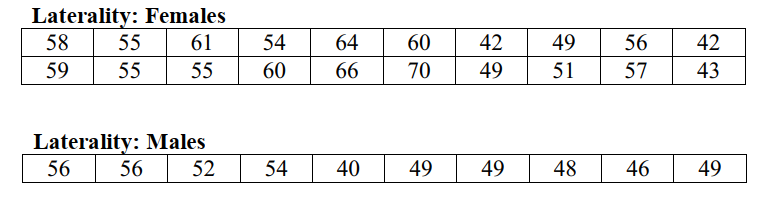 , compare the distributions of laterality index formales and females. Justify your comparisons by appealing to specific aspects of thebox plots constructed in
 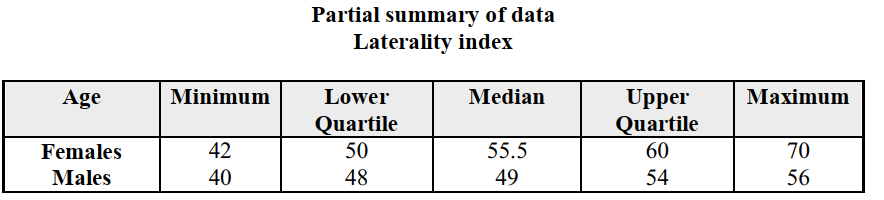 .
.
(Essay)
4.9/5 (40)
The interquartile range is a measure of spread in a set of data.
(True/False)
4.8/5 (40)
The table below presents some summary statistics from the distribution of laterality index of males and females
 -Construct comparative box plots of the laterality indices of female and malecottonmouths.Male
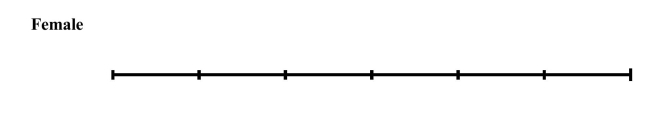
(Essay)
4.9/5 (27)
Filters
- Essay(0)
- Multiple Choice(0)
- Short Answer(0)
- True False(0)
- Matching(0)