Exam 12: Asking and Answering Questions About a Population Mean
Exam 1: Collecting Data in Reasonable Ways44 Questions
Exam 2: Graphical Methods for31 Questions
Exam 3: Numerical Methods for31 Questions
Exam 4: Describing Bivariate Numerical Data29 Questions
Exam 5: Probability29 Questions
Exam 6: Random Variables and18 Questions
Exam 7: Selecting an Appropriate Method4 Questions
Exam 8: Sampling Variability Sampling21 Questions
Exam 9: Estimation Using a Single Sample29 Questions
Exam 10: Asking and Answering Questions About a Population Proportion36 Questions
Exam 11: Asking and Answering Questions About the Difference Between Two Population Proportions16 Questions
Exam 12: Asking and Answering Questions About a Population Mean33 Questions
Exam 13: Asking and Answering Questions About the Difference Between Two Means27 Questions
Exam 14: Learning From Experiment Data8 Questions
Exam 15: Learning From Categorical Data22 Questions
Exam 16: Understanding Relationships Numerical12 Questions
Select questions type
All other things being equal, choosing a smaller value of ? will increasethe probability of making a type II error.
Free
(True/False)
4.8/5  (42)
(42)
Correct Answer: Verified
True
In a few sentences, describe the difference between statistical and practicalsignificance.
Free
(Essay)
4.9/5 (35)
Correct Answer:Verified
Statistical significance means that the difference between what is observed and what is expected is too large to be due to chance alone.Practical significance refers to a "meaningful" or "useful" difference.
If the null hypothesis is not rejected, there is strong statistical evidencethat the null hypothesis is true.
(True/False)
4.9/5 (28)
The department of natural resources classifies a fish to be unsafe to eat if itspolychlorinated biphenol (PCB) concentration exceeds 5 parts per billion (ppb). Arandom sample of 10 fish taken from a local lake resulted in the concentrations listedbelow:  The department if natural resources is concerned that the mean PCB concentration forfish from this lake exceeds 5 ppb.
a) What null and alternative hypotheses should the investigators use?
In a fewsentences, justify your choice of the alternative hypothesis.
b) Using a graphic technique of your choice, show that the t-procedures areappropriate to use with these data.
c) Using your hypotheses from part (a), carry out a hypothesis test using ?= 0.05and interpret the results.
d) In the context of this study, describe a Type I and a Type II error.
The department if natural resources is concerned that the mean PCB concentration forfish from this lake exceeds 5 ppb.
a) What null and alternative hypotheses should the investigators use?
In a fewsentences, justify your choice of the alternative hypothesis.
b) Using a graphic technique of your choice, show that the t-procedures areappropriate to use with these data.
c) Using your hypotheses from part (a), carry out a hypothesis test using ?= 0.05and interpret the results.
d) In the context of this study, describe a Type I and a Type II error.
(Essay)
4.7/5 (35)
A very large study of college students' study habits found that the time (in hours) thatfreshmen study each week is approximately normal with mean 24 hours and standarddeviation 8 hours. Consider random samples of size 16 from the population of freshmen.
a) On the axes below, sketch curves representing the distribution of the original populationand the sampling distribution of for samples of size n =16 . Be sure to indicate whichcurve is which. What are the mean and standard deviation of the sampling distributionof ?
 b) What is the probability that a sample of size n = 16 from this population would result ina sample mean greater than 30 hours?
The study of college freshmen also asked about the students' time spent playing video games.Suppose that the population relative frequency histogram for time spend playing video games isas shown below. The mean amount of time spent playing video games was 0.8 hours per week.Relative Frequency
b) What is the probability that a sample of size n = 16 from this population would result ina sample mean greater than 30 hours?
The study of college freshmen also asked about the students' time spent playing video games.Suppose that the population relative frequency histogram for time spend playing video games isas shown below. The mean amount of time spent playing video games was 0.8 hours per week.Relative Frequency 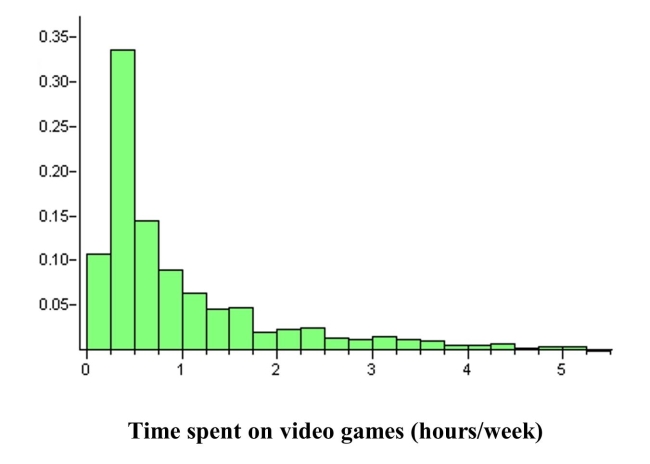 c) Suppose you were to take a random sample, n = 4, from this population of freshmen andask them how much time they spent playing video games per week. Describe the shape,center, and spread of the sampling distribution of , as compared to the populationdistribution.
(Essay)
4.7/5 (34)
Give as much information as you can about the P-value of a t-test in the followingsituations:
a) Two-tailed test, nt=14, = 2.4
b) Upper-tailed test, nt= 22, =1.9
(Essay)
4.8/5 (34)
Logging activity in forests is thought to affect the behavior of black bears (Ursusamericanus). An important measure of animal behavior is the home range, the area used byanimals in their lives. In a study of black bears in a logged Canadian forest, the spring andearly summer home range (in km2 ) of 12 radio-collared female black bears was measuredwith the following results:  a) Construct and interpret a 95% confidence interval for the mean home range of femaleblack bears in this logged forest.
b) The typical home range of females in forests with no logging is 20 km2 . Based on theconfidence interval from part (a), do you think that the mean home range size of femalesin this logged forest could be the same as the mean home range size in non-loggedforests?
a) Construct and interpret a 95% confidence interval for the mean home range of femaleblack bears in this logged forest.
b) The typical home range of females in forests with no logging is 20 km2 . Based on theconfidence interval from part (a), do you think that the mean home range size of femalesin this logged forest could be the same as the mean home range size in non-loggedforests?
(Essay)
4.9/5 (33)
A t curve is bell-shaped like the z curve but is less spread out.
(True/False)
4.9/5 (35)
Give as much information as you can about the P-value of a t-test in the followingsituations: 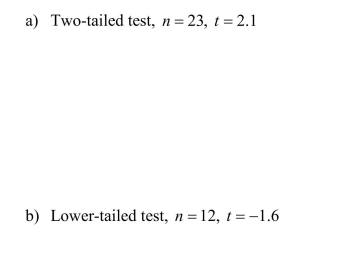
(Essay)
4.8/5 (36)
When the hatching of young geese is very near, the father guards the nest to defend itfrom predators that may be attracted by the hatchlings noisy entrance into the world.The following data are the typical distances from the nest for 24 soon to be fathergeese. A biologist would like to construct a 95% confidence interval for the meandistance of future father geese from the nest during this period. (Distances are in km.) 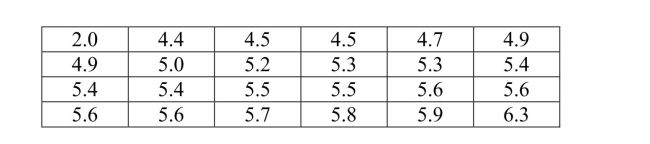 a) Using a graphical display of your choice, display the data in a way that will allowyou to determine whether it would be appropriate to use a 95% t confidenceinterval to estimate the population mean.
b) Using the graphical display from part (a), would you advise that constructing a95% t confidence interval is appropriate?
Explain the basis of yourrecommendation.
a) Using a graphical display of your choice, display the data in a way that will allowyou to determine whether it would be appropriate to use a 95% t confidenceinterval to estimate the population mean.
b) Using the graphical display from part (a), would you advise that constructing a95% t confidence interval is appropriate?
Explain the basis of yourrecommendation.
(Essay)
4.7/5 (34)
A boat manufacturer claims that a particular boat model and motor combination willburn less than 4.0 gallons of fuel per hour. Fuel consumption for a random sample of10 similar boats was measured, resulting in the data below:  A consumer group is interested in determining if there is convincing evidence that themanufacturer's claim is correct.
a) What null and alternative hypotheses should the investigators use?
In a fewsentences, justify your choice of the alternative hypothesis.
b) Using a graphic technique of your choice, show that the t-procedures areappropriate to use with these data.
c) Using your hypotheses from part (a), carry out a hypothesis test using ?= 0.05and interpret the results.
d) In the context of this study, describe a Type I and a Type II error.
A consumer group is interested in determining if there is convincing evidence that themanufacturer's claim is correct.
a) What null and alternative hypotheses should the investigators use?
In a fewsentences, justify your choice of the alternative hypothesis.
b) Using a graphic technique of your choice, show that the t-procedures areappropriate to use with these data.
c) Using your hypotheses from part (a), carry out a hypothesis test using ?= 0.05and interpret the results.
d) In the context of this study, describe a Type I and a Type II error.
(Essay)
4.7/5 (43)
The State Fisheries Department wishes to stock the Styx River with fish, and would like thespecies to not only survive but thrive. The "substrate" (pebble size at bottom) of a river is animportant determinant of the quality of spawning habitat. Unknown to the Fisheriesofficials, the pebble diameters in the Sty x River are approximately normally distributed witha mean of 24 mm, and a standard deviation of 8 mm. Fisheries officials will select a randomsample of pebbles in an attempt to estimate the average pebble size.
a) On the scale below, sketch two curves, one representing the distribution of the originalpopulation and the other the sampling distribution of for a sample of size n =16 . Besure to indicate which curve is which. What are the mean and standard deviation of thesampling distribution of ?
 b) What is the approximate probability that a sample of n = 16 from this population wouldresult in a sample mean greater than 30 mm?
The graph below is a relative frequency histogram of the lengths of the gentle Hecate fish in theStyx River, as recorded during a large fish tagging survey. You can assume that this histogramrepresents the population of fish lengths.Relative Frequency
b) What is the approximate probability that a sample of n = 16 from this population wouldresult in a sample mean greater than 30 mm?
The graph below is a relative frequency histogram of the lengths of the gentle Hecate fish in theStyx River, as recorded during a large fish tagging survey. You can assume that this histogramrepresents the population of fish lengths.Relative Frequency 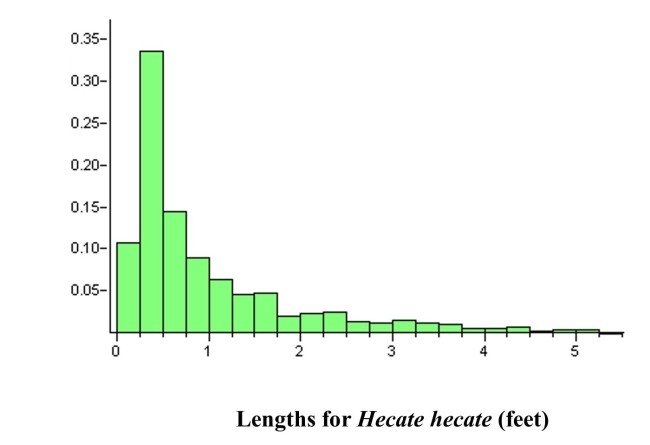 c) Suppose you were to take a random sample, n = 4, from this population of fish andmeasure their lengths. Describe the shape, center, and spread of the samplingdistribution of , as compared to the population distribution.
(Essay)
4.8/5 (35)
When performing hypothesis tests, there are assumptions that must be met in order for the testto be appropriate. Describe the assumptions associated with a hypothesis test about apopulation mean when the sample size is small. For any assumptions that can be checkedusing sample data, describe how the check would be performed.
(Essay)
4.7/5 (41)
Consider sampling from a normal population with a population mean µ and standarddeviation ?. As the sample size, n, increases, some characteristics of the sampling distribution of the sample mean, , may change. Which of the following characteristics will change as n increases, and what is the nature of the change?
a) The mean of the sampling distribution of
b) The standard deviation of the sampling distribution of
c) The shape of the sampling distribution of
(Essay)
4.8/5 (40)
We say that the result of a hypothesis test is "statistically significant"when the P-value is less than or equal to ?.
(True/False)
4.7/5 (40)
The t confidence interval formula for estimating µ is appropriate whenthe population being sampled is approximately normally distributed.
(True/False)
4.9/5 (37)
Filters
- Essay(0)
- Multiple Choice(0)
- Short Answer(0)
- True False(0)
- Matching(0)