Exam 8: Basics of Functions
Exam 1: Variables, Real Numbers, and Mathematical Models147 Questions
Exam 2: Linear Equations and Inequalities in One Variable181 Questions
Exam 3: Linear Equations in Two Variables121 Questions
Exam 4: Systems of Linear Equations118 Questions
Exam 5: Exponents and Polynomials122 Questions
Exam 6: Factoring Polynomials118 Questions
Exam 7: Rational Expressions135 Questions
Exam 8: Basics of Functions90 Questions
Exam 9: Inequalities and Problem Solving93 Questions
Exam 10: Radicals, Radical Functions, and Rational Exponents102 Questions
Select questions type
Use the graph to find the indicated function value.
-y = f(x). Find f(-4) 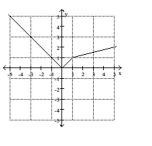
(Multiple Choice)
4.8/5  (32)
(32)
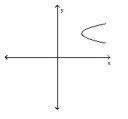
Use the vertical line test to determine whether or not the graph is a graph of a function.
-
(Multiple Choice)
4.8/5 (44)
The graph below shows the percentage of students enrolled in the College of Engineering at State University. Use the graph to
answer the question. 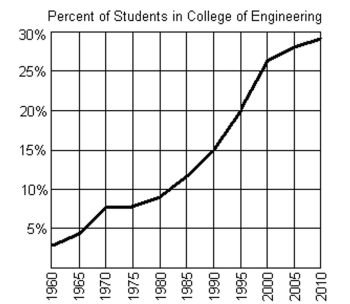 -If f(x) = 15%, what year is represented by x?
(Multiple Choice)
4.8/5 (33)
Find the indicated function value.
- x f(x) -3 0 -1 10 0 15 1 20 3 30 Find f(-1)
(Multiple Choice)
4.9/5 (35)
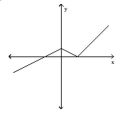
Use the vertical line test to determine whether or not the graph is a graph of a function.
-
(Multiple Choice)
4.8/5 (33)
Filters
- Essay(0)
- Multiple Choice(0)
- Short Answer(0)
- True False(0)
- Matching(0)