Exam 15: Multiple Regression
Exam 1: Defining and Collecting Data202 Questions
Exam 2: Organizing and Visualizing256 Questions
Exam 3: Numerical Descriptive Measures217 Questions
Exam 4: Basic Probability167 Questions
Exam 5: Discrete Probability Distributions165 Questions
Exam 6: The Normal Distribution and Other Continuous Distributions170 Questions
Exam 7: Sampling Distributions165 Questions
Exam 8: Confidence Interval Estimation219 Questions
Exam 9: Fundamentals of Hypothesis Testing: One-Sample Tests194 Questions
Exam 10: Two-Sample Tests240 Questions
Exam 11: Analysis of Variance170 Questions
Exam 12: Chi-Square and Nonparametric188 Questions
Exam 13: Simple Linear Regression243 Questions
Exam 14: Introduction to Multiple394 Questions
Exam 15: Multiple Regression146 Questions
Exam 16: Time-Series Forecasting235 Questions
Exam 17: Getting Ready to Analyze Data386 Questions
Exam 18: Statistical Applications in Quality Management159 Questions
Exam 19: Decision Making126 Questions
Exam 20: Probability and Combinatorics421 Questions
Select questions type
SCENARIO 15-7-B
You are the CEO of a dairy company. You are planning to expand milk production by purchasing
additional cows, lands and hiring more workers. From the existing 50 farms owned by the company,
you have collected data on total milk production (in liters), the number of milking cows, land size (in
acres) and the number of laborers. The data are shown below and also available in the Excel file
Scenario15-7-DataB.XLSX. 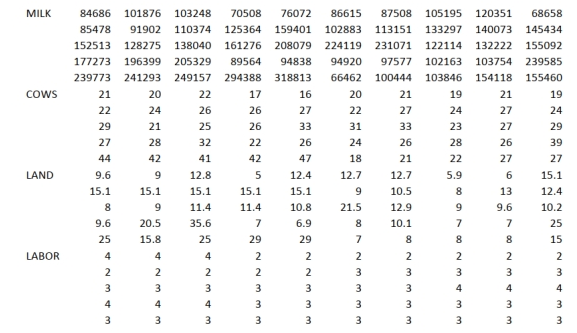 You believe that the number of milking cows , land size and the number of laborers are the best predictors for total milk production on any given farm.
-Referring to Scenario 15-7-B, the variable X1 should be dropped to remove
collinearity?
You believe that the number of milking cows , land size and the number of laborers are the best predictors for total milk production on any given farm.
-Referring to Scenario 15-7-B, the variable X1 should be dropped to remove
collinearity?
Free
(True/False)
4.9/5  (44)
(44)
Correct Answer: Verified
False
SCENARIO 15-7-A
You are the CEO of a dairy company. You are planning to expand milk production by purchasing
additional cows, lands and hiring more workers. From the existing 50 farms owned by the company,
you have collected data on total milk production (in liters), the number of milking cows, land size (in
acres) and the number of laborers. The data are shown below and also available in the Excel file
Scenario15-7-DataA.XLSX. 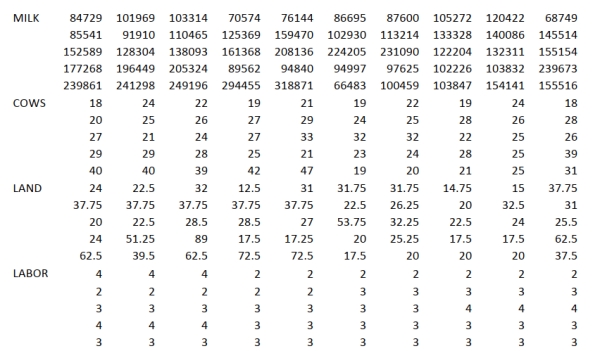 You believe that the number of milking cows , land size and the number of laborers are the best predictors for total milk production on any given farm.
-Referring to Scenario 15-7-A, the p value of the t test statistic for testing whether the quadratic
term for land size is statistically significant after you have performed a multiple regression that
includes the quadratic terms for the number of milking cows, land size and the number of laborers
is _____.
You believe that the number of milking cows , land size and the number of laborers are the best predictors for total milk production on any given farm.
-Referring to Scenario 15-7-A, the p value of the t test statistic for testing whether the quadratic
term for land size is statistically significant after you have performed a multiple regression that
includes the quadratic terms for the number of milking cows, land size and the number of laborers
is _____.
Free
(Short Answer)
4.8/5 (31)
Correct Answer:Verified
0.5799
SCENARIO 15-7-B
You are the CEO of a dairy company. You are planning to expand milk production by purchasing
additional cows, lands and hiring more workers. From the existing 50 farms owned by the company,
you have collected data on total milk production (in liters), the number of milking cows, land size (in
acres) and the number of laborers. The data are shown below and also available in the Excel file
Scenario15-7-DataB.XLSX.
You believe that the number of milking cows , land size and the number of laborers are the best predictors for total milk production on any given farm.
-Referring to Scenario 15-7-B, the model that includes only should be
among the appropriate models using the Mallow's Cp statistic.
Free
(True/False)
4.8/5 (25)
Correct Answer:Verified
False
SCENARIO 15-7-A
You are the CEO of a dairy company. You are planning to expand milk production by purchasing
additional cows, lands and hiring more workers. From the existing 50 farms owned by the company,
you have collected data on total milk production (in liters), the number of milking cows, land size (in
acres) and the number of laborers. The data are shown below and also available in the Excel file
Scenario15-7-DataA.XLSX. You believe that the number of milking cows , land size and the number of laborers are the best predictors for total milk production on any given farm.
-Referring to Scenario 15-7-A, the value of the t test statistic for testing whether the quadratic
term for land size is statistically significant after you have performed a multiple regression that
includes the quadratic terms for the number of milking cows, land size and the number of laborers
is _____.
(Short Answer)
4.9/5 (33)
SCENARIO 15-7-B
You are the CEO of a dairy company. You are planning to expand milk production by purchasing
additional cows, lands and hiring more workers. From the existing 50 farms owned by the company,
you have collected data on total milk production (in liters), the number of milking cows, land size (in
acres) and the number of laborers. The data are shown below and also available in the Excel file
Scenario15-7-DataB.XLSX.
You believe that the number of milking cows , land size and the number of laborers are the best predictors for total milk production on any given farm.
-Referring to Scenario 15-7-B, there is insufficient evidence to conclude that
the quadratic term for the number of milking cows is statistically significant at the 10% level of
significance after you have performed a multiple regression that includes the quadratic terms for
the number of milking cows, land size and the number of laborers.
(True/False)
4.9/5 (38)
SCENARIO 15-4
The superintendent of a school district wanted to predict the percentage of students passing a sixth-
grade proficiency test. She obtained the data on percentage of students passing the proficiency test
(% Passing), daily mean of the percentage of students attending class (% Attendance), mean teacher
salary in dollars (Salaries), and instructional spending per pupil in dollars (Spending) of 47 schools in
the state. 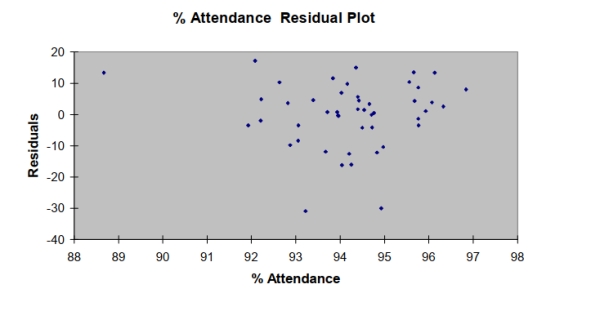 -Referring to Scenario 15-4, the "best" model chosen using the adjusted R-square statistic is a)
b)
c) either of the above
d) None of the above
-Referring to Scenario 15-4, the "best" model chosen using the adjusted R-square statistic is a)
b)
c) either of the above
d) None of the above
(Short Answer)
4.9/5 (37)
SCENARIO 15-7-A
You are the CEO of a dairy company. You are planning to expand milk production by purchasing
additional cows, lands and hiring more workers. From the existing 50 farms owned by the company,
you have collected data on total milk production (in liters), the number of milking cows, land size (in
acres) and the number of laborers. The data are shown below and also available in the Excel file
Scenario15-7-DataA.XLSX. You believe that the number of milking cows , land size and the number of laborers are the best predictors for total milk production on any given farm.
-Referring to Scenario 15-7-A, the model that includes only should be
among the appropriate models using the Mallow's Cp statistic.
(True/False)
4.8/5 (34)
SCENARIO 15-7-B
You are the CEO of a dairy company. You are planning to expand milk production by purchasing
additional cows, lands and hiring more workers. From the existing 50 farms owned by the company,
you have collected data on total milk production (in liters), the number of milking cows, land size (in
acres) and the number of laborers. The data are shown below and also available in the Excel file
Scenario15-7-DataB.XLSX.
You believe that the number of milking cows , land size and the number of laborers are the best predictors for total milk production on any given farm.
-Referring to Scenario 15-7-B, there is insufficient evidence to conclude that
the quadratic term for land size is statistically significant at the 10% level of significance after
you have performed a multiple regression that includes the quadratic terms for the number of
milking cows, land size and the number of laborers.
(True/False)
4.8/5 (35)
SCENARIO 15-7-A
You are the CEO of a dairy company. You are planning to expand milk production by purchasing
additional cows, lands and hiring more workers. From the existing 50 farms owned by the company,
you have collected data on total milk production (in liters), the number of milking cows, land size (in
acres) and the number of laborers. The data are shown below and also available in the Excel file
Scenario15-7-DataA.XLSX. You believe that the number of milking cows , land size and the number of laborers are the best predictors for total milk production on any given farm.
-Referring to Scenario 15-7-A, the variable should be dropped to remove
collinearity?
(True/False)
4.8/5 (34)
SCENARIO 15-4
The superintendent of a school district wanted to predict the percentage of students passing a sixth-
grade proficiency test. She obtained the data on percentage of students passing the proficiency test
(% Passing), daily mean of the percentage of students attending class (% Attendance), mean teacher
salary in dollars (Salaries), and instructional spending per pupil in dollars (Spending) of 47 schools in
the state.
-Referring to Scenario 15-4, the residual plot suggests that a nonlinear model on %
attendance may be a better model.
(True/False)
4.9/5 (35)
SCENARIO 15-7-A
You are the CEO of a dairy company. You are planning to expand milk production by purchasing
additional cows, lands and hiring more workers. From the existing 50 farms owned by the company,
you have collected data on total milk production (in liters), the number of milking cows, land size (in
acres) and the number of laborers. The data are shown below and also available in the Excel file
Scenario15-7-DataA.XLSX. You believe that the number of milking cows , land size and the number of laborers are the best predictors for total milk production on any given farm.
-Referring to Scenario 15-7-A, there is sufficient evidence to conclude that the
quadratic term for the number of laborers is statistically significant at the 10% level of
significance after you have performed a multiple regression that includes the quadratic terms for
the number of milking cows, land size and the number of laborers.
(True/False)
4.8/5 (34)
SCENARIO 15-7-A
You are the CEO of a dairy company. You are planning to expand milk production by purchasing
additional cows, lands and hiring more workers. From the existing 50 farms owned by the company,
you have collected data on total milk production (in liters), the number of milking cows, land size (in
acres) and the number of laborers. The data are shown below and also available in the Excel file
Scenario15-7-DataA.XLSX. You believe that the number of milking cows , land size and the number of laborers are the best predictors for total milk production on any given farm.
-Referring to Scenario 15-7-A, the variable should be dropped to remove
collinearity?
(True/False)
4.9/5 (31)
SCENARIO 15-7-B
You are the CEO of a dairy company. You are planning to expand milk production by purchasing
additional cows, lands and hiring more workers. From the existing 50 farms owned by the company,
you have collected data on total milk production (in liters), the number of milking cows, land size (in
acres) and the number of laborers. The data are shown below and also available in the Excel file
Scenario15-7-DataB.XLSX.
You believe that the number of milking cows , land size and the number of laborers are the best predictors for total milk production on any given farm.
-Referring to Scenario 15-7-B, the p value of the t test statistic for testing whether the quadratic
term for the number of laborers is statistically significant after you have performed a multiple
regression that includes the quadratic terms for the number of milking cows, land size and the
number of laborers is ______.
(Short Answer)
4.8/5 (30)
SCENARIO 15-6 Given below are results from the regression analysis on 40 observations where the dependent variable is the number of weeks a worker is unemployed due to a layoff and the independent variables are the age of the worker , the number of years of education received , the number of years at the previous job , a dummy variable for marital status ( married, otherwise), a dummy variable for head of household yes, no) and a dummy variable for management position yes, no .
The coefficient of multiple determination for the regression model using each of the 6 variables as the dependent variable and all other variables as independent variables are, respectively, and .
The partial results from best-subset regression are given below:
Model R Square Adj. R Square Std. Error X1X5X6 0.4568 0.4116 18.3534 X1X2X5X6 0.4697 0.4091 18.3919 X1X3X5X6 0.4691 0.4084 18.4023 X1X2X3X5X6 0.4877 0.4123 18.3416 X1X2X3X4X5X6 0.4949 0.4030 18.4861
-Referring to Scenario 15-6, the model that includes should be
among the appropriate models using the Mallow's statistic.
(True/False)
4.9/5 (34)
SCENARIO 15-7-A
You are the CEO of a dairy company. You are planning to expand milk production by purchasing
additional cows, lands and hiring more workers. From the existing 50 farms owned by the company,
you have collected data on total milk production (in liters), the number of milking cows, land size (in
acres) and the number of laborers. The data are shown below and also available in the Excel file
Scenario15-7-DataA.XLSX. You believe that the number of milking cows , land size and the number of laborers are the best predictors for total milk production on any given farm.
-Referring to Scenario 15-7-A, the p value of the t test statistic for testing whether the quadratic
term for the number of milking cows is statistically significant after you have performed a
multiple regression that includes the quadratic terms for the number of milking cows, land size
and the number of laborers is _____.
(Short Answer)
4.8/5 (31)
SCENARIO 15-7-B
You are the CEO of a dairy company. You are planning to expand milk production by purchasing
additional cows, lands and hiring more workers. From the existing 50 farms owned by the company,
you have collected data on total milk production (in liters), the number of milking cows, land size (in
acres) and the number of laborers. The data are shown below and also available in the Excel file
Scenario15-7-DataB.XLSX.
You believe that the number of milking cows , land size and the number of laborers are the best predictors for total milk production on any given farm.
-Referring to Scenario 15-7-B, you should not keep the quadratic term for the
number of milking cows at the 10% level of significance after you have performed a multiple
regression that includes the quadratic terms for the number of milking cows, land size and the
number of laborers.
(True/False)
4.8/5 (27)
SCENARIO 15-7-B
You are the CEO of a dairy company. You are planning to expand milk production by purchasing
additional cows, lands and hiring more workers. From the existing 50 farms owned by the company,
you have collected data on total milk production (in liters), the number of milking cows, land size (in
acres) and the number of laborers. The data are shown below and also available in the Excel file
Scenario15-7-DataB.XLSX.
You believe that the number of milking cows , land size and the number of laborers are the best predictors for total milk production on any given farm.
-Referring to Scenario 15-7-B, you should not keep the quadratic term for land
size at the 10% level of significance after you have performed a multiple regression that includes
the quadratic terms for the number of milking cows, land size and the number of laborers.
(True/False)
4.8/5 (34)
A real estate builder wishes to determine how house size (House) is influenced by family income (Income), family size (Size), and education of the head of household (School). House size is
Measured in hundreds of square feet, income is measured in thousands of dollars, and education is
In years. The builder randomly selected 50 families and constructed the multiple regression
Model. The business literature involving human capital shows that education influences an
Individual's annual income. Combined, these may influence family size. With this in mind, what
Should the real estate builder be particularly concerned with when analyzing the multiple
Regression model?
(Multiple Choice)
4.9/5 (29)
SCENARIO 15-7-A
You are the CEO of a dairy company. You are planning to expand milk production by purchasing
additional cows, lands and hiring more workers. From the existing 50 farms owned by the company,
you have collected data on total milk production (in liters), the number of milking cows, land size (in
acres) and the number of laborers. The data are shown below and also available in the Excel file
Scenario15-7-DataA.XLSX. You believe that the number of milking cows , land size and the number of laborers are the best predictors for total milk production on any given farm.
-Referring to Scenario 15-7-A, the value of the variance inflationary factor of the number of
laborers is _____.
(Short Answer)
4.9/5 (32)
SCENARIO 15-7-A
You are the CEO of a dairy company. You are planning to expand milk production by purchasing
additional cows, lands and hiring more workers. From the existing 50 farms owned by the company,
you have collected data on total milk production (in liters), the number of milking cows, land size (in
acres) and the number of laborers. The data are shown below and also available in the Excel file
Scenario15-7-DataA.XLSX. You believe that the number of milking cows , land size and the number of laborers are the best predictors for total milk production on any given farm.
-Referring to Scenario 15-7-A, the value of the variance inflationary factor of the number of
milking cows is _____.
(Short Answer)
4.9/5 (36)
Filters
- Essay(0)
- Multiple Choice(0)
- Short Answer(0)
- True False(0)
- Matching(0)