Exam 15: Multiple Regression
Exam 1: Defining and Collecting Data202 Questions
Exam 2: Organizing and Visualizing256 Questions
Exam 3: Numerical Descriptive Measures217 Questions
Exam 4: Basic Probability167 Questions
Exam 5: Discrete Probability Distributions165 Questions
Exam 6: The Normal Distribution and Other Continuous Distributions170 Questions
Exam 7: Sampling Distributions165 Questions
Exam 8: Confidence Interval Estimation219 Questions
Exam 9: Fundamentals of Hypothesis Testing: One-Sample Tests194 Questions
Exam 10: Two-Sample Tests240 Questions
Exam 11: Analysis of Variance170 Questions
Exam 12: Chi-Square and Nonparametric188 Questions
Exam 13: Simple Linear Regression243 Questions
Exam 14: Introduction to Multiple394 Questions
Exam 15: Multiple Regression146 Questions
Exam 16: Time-Series Forecasting235 Questions
Exam 17: Getting Ready to Analyze Data386 Questions
Exam 18: Statistical Applications in Quality Management159 Questions
Exam 19: Decision Making126 Questions
Exam 20: Probability and Combinatorics421 Questions
Select questions type
A microeconomist wants to determine how corporate sales are influenced by capital and wage spending by companies. She proceeds to randomly select 26 large corporations and record
Information in millions of dollars. A statistical analyst discovers that capital spending by
Corporations has a significant inverse relationship with wage spending. What should the
Microeconomist who developed this multiple regression model be particularly concerned with?
(Multiple Choice)
4.9/5  (30)
(30)
SCENARIO 15-6 Given below are results from the regression analysis on 40 observations where the dependent variable is the number of weeks a worker is unemployed due to a layoff and the independent variables are the age of the worker , the number of years of education received , the number of years at the previous job , a dummy variable for marital status ( married, otherwise), a dummy variable for head of household yes, no) and a dummy variable for management position yes, no .
The coefficient of multiple determination for the regression model using each of the 6 variables as the dependent variable and all other variables as independent variables are, respectively, and .
The partial results from best-subset regression are given below:
Model R Square Adj. R Square Std. Error X1X5X6 0.4568 0.4116 18.3534 X1X2X5X6 0.4697 0.4091 18.3919 X1X3X5X6 0.4691 0.4084 18.4023 X1X2X3X5X6 0.4877 0.4123 18.3416 X1X2X3X4X5X6 0.4949 0.4030 18.4861
-Referring to Scenario 15-6, the model that includes should be
among the appropriate models using the Mallow's statistic.
(True/False)
5.0/5 (37)
SCENARIO 15-6 Given below are results from the regression analysis on 40 observations where the dependent variable is the number of weeks a worker is unemployed due to a layoff and the independent variables are the age of the worker , the number of years of education received , the number of years at the previous job , a dummy variable for marital status ( married, otherwise), a dummy variable for head of household yes, no) and a dummy variable for management position yes, no .
The coefficient of multiple determination for the regression model using each of the 6 variables as the dependent variable and all other variables as independent variables are, respectively, and .
The partial results from best-subset regression are given below:
Model R Square Adj. R Square Std. Error X1X5X6 0.4568 0.4116 18.3534 X1X2X5X6 0.4697 0.4091 18.3919 X1X3X5X6 0.4691 0.4084 18.4023 X1X2X3X5X6 0.4877 0.4123 18.3416 X1X2X3X4X5X6 0.4949 0.4030 18.4861
-Referring to Scenario 15-6, what is the value of the variance inflationary factor of Head?
(Short Answer)
4.8/5 (35)
SCENARIO 15-6 Given below are results from the regression analysis on 40 observations where the dependent variable is the number of weeks a worker is unemployed due to a layoff and the independent variables are the age of the worker , the number of years of education received , the number of years at the previous job , a dummy variable for marital status ( married, otherwise), a dummy variable for head of household yes, no) and a dummy variable for management position yes, no .
The coefficient of multiple determination for the regression model using each of the 6 variables as the dependent variable and all other variables as independent variables are, respectively, and .
The partial results from best-subset regression are given below:
Model R Square Adj. R Square Std. Error X1X5X6 0.4568 0.4116 18.3534 X1X2X5X6 0.4697 0.4091 18.3919 X1X3X5X6 0.4691 0.4084 18.4023 X1X2X3X5X6 0.4877 0.4123 18.3416 X1X2X3X4X5X6 0.4949 0.4030 18.4861
-Referring to Scenario 15-6, the variable X5 should be dropped to remove
collinearity?
(True/False)
4.9/5 (36)
SCENARIO 15-7-A
You are the CEO of a dairy company. You are planning to expand milk production by purchasing
additional cows, lands and hiring more workers. From the existing 50 farms owned by the company,
you have collected data on total milk production (in liters), the number of milking cows, land size (in
acres) and the number of laborers. The data are shown below and also available in the Excel file
Scenario15-7-DataA.XLSX. 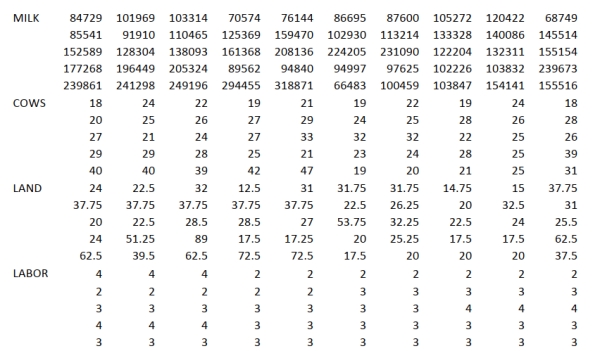 You believe that the number of milking cows , land size and the number of laborers are the best predictors for total milk production on any given farm.
-Referring to Scenario 15-7-A, the value of the t test statistic for testing whether the quadratic
term for the number of laborers is statistically significant after you have performed a multiple
regression that includes the quadratic terms for the number of milking cows, land size and the
number of laborers is _____.
You believe that the number of milking cows , land size and the number of laborers are the best predictors for total milk production on any given farm.
-Referring to Scenario 15-7-A, the value of the t test statistic for testing whether the quadratic
term for the number of laborers is statistically significant after you have performed a multiple
regression that includes the quadratic terms for the number of milking cows, land size and the
number of laborers is _____.
(Short Answer)
4.8/5 (35)
SCENARIO 15-6 Given below are results from the regression analysis on 40 observations where the dependent variable is the number of weeks a worker is unemployed due to a layoff and the independent variables are the age of the worker , the number of years of education received , the number of years at the previous job , a dummy variable for marital status ( married, otherwise), a dummy variable for head of household yes, no) and a dummy variable for management position yes, no .
The coefficient of multiple determination for the regression model using each of the 6 variables as the dependent variable and all other variables as independent variables are, respectively, and .
The partial results from best-subset regression are given below:
Model R Square Adj. R Square Std. Error X1X5X6 0.4568 0.4116 18.3534 X1X2X5X6 0.4697 0.4091 18.3919 X1X3X5X6 0.4691 0.4084 18.4023 X1X2X3X5X6 0.4877 0.4123 18.3416 X1X2X3X4X5X6 0.4949 0.4030 18.4861
-Referring to Scenario 15-6, the model that includes should be among
the appropriate models using the Mallow's statistic.
(True/False)
4.9/5 (35)
SCENARIO 15-7-B
You are the CEO of a dairy company. You are planning to expand milk production by purchasing
additional cows, lands and hiring more workers. From the existing 50 farms owned by the company,
you have collected data on total milk production (in liters), the number of milking cows, land size (in
acres) and the number of laborers. The data are shown below and also available in the Excel file
Scenario15-7-DataB.XLSX. 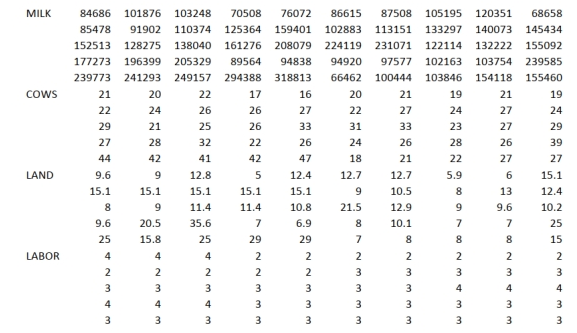 You believe that the number of milking cows , land size and the number of laborers are the best predictors for total milk production on any given farm.
-Referring to Scenario 15-7-B, the model that includes all three independent
variables should be selected using the adjusted statistic.
You believe that the number of milking cows , land size and the number of laborers are the best predictors for total milk production on any given farm.
-Referring to Scenario 15-7-B, the model that includes all three independent
variables should be selected using the adjusted statistic.
(True/False)
4.9/5 (37)
SCENARIO 15-7-A
You are the CEO of a dairy company. You are planning to expand milk production by purchasing
additional cows, lands and hiring more workers. From the existing 50 farms owned by the company,
you have collected data on total milk production (in liters), the number of milking cows, land size (in
acres) and the number of laborers. The data are shown below and also available in the Excel file
Scenario15-7-DataA.XLSX. You believe that the number of milking cows , land size and the number of laborers are the best predictors for total milk production on any given farm.
-Referring to Scenario 15-7-A, you should keep the quadratic term for land size
at the 10% level of significance after you have performed a multiple regression that includes the
quadratic terms for the number of milking cows, land size and the number of laborers.
(True/False)
4.7/5 (34)
The parameter estimates are biased when collinearity is present in a multiple
regression equation.
(True/False)
4.9/5 (26)
SCENARIO 15-7-A
You are the CEO of a dairy company. You are planning to expand milk production by purchasing
additional cows, lands and hiring more workers. From the existing 50 farms owned by the company,
you have collected data on total milk production (in liters), the number of milking cows, land size (in
acres) and the number of laborers. The data are shown below and also available in the Excel file
Scenario15-7-DataA.XLSX. You believe that the number of milking cows , land size and the number of laborers are the best predictors for total milk production on any given farm.
-Referring to Scenario 15-7-A, what is your decision on testing whether the quadratic term for
the number of laborers is statistically significant at the 10% level of significance after you have
performed a multiple regression that includes the quadratic terms for the number of milking cows,
land size and the number of laborers?
(Short Answer)
4.9/5 (35)
SCENARIO 15-6 Given below are results from the regression analysis on 40 observations where the dependent variable is the number of weeks a worker is unemployed due to a layoff and the independent variables are the age of the worker , the number of years of education received , the number of years at the previous job , a dummy variable for marital status ( married, otherwise), a dummy variable for head of household yes, no) and a dummy variable for management position yes, no .
The coefficient of multiple determination for the regression model using each of the 6 variables as the dependent variable and all other variables as independent variables are, respectively, and .
The partial results from best-subset regression are given below:
Model R Square Adj. R Square Std. Error X1X5X6 0.4568 0.4116 18.3534 X1X2X5X6 0.4697 0.4091 18.3919 X1X3X5X6 0.4691 0.4084 18.4023 X1X2X3X5X6 0.4877 0.4123 18.3416 X1X2X3X4X5X6 0.4949 0.4030 18.4861
-Referring to Scenario 15-6, the model that includes should be selected using the
adjusted statistic.
(True/False)
4.8/5 (37)
SCENARIO 15-3
A chemist employed by a pharmaceutical firm has developed a muscle relaxant. She took a sample of
14 people suffering from extreme muscle constriction. She gave each a vial containing a dose (X) of
the drug and recorded the time to relief (Y) measured in seconds for each. She fit a curvilinear model
to this data. The results obtained by Microsoft Excel follow 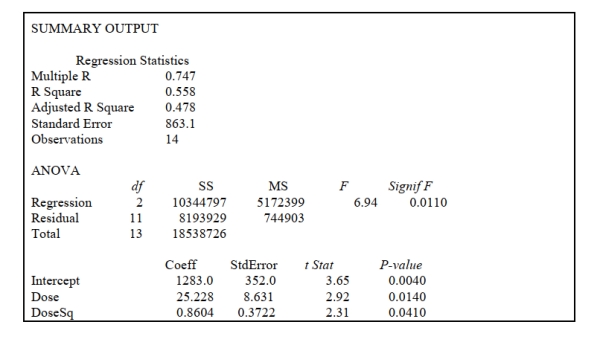 -Referring to Scenario 15-3, suppose the chemist decides to use a t test to determine if the linear
term is significant. The p-value of the test is ______.
-Referring to Scenario 15-3, suppose the chemist decides to use a t test to determine if the linear
term is significant. The p-value of the test is ______.
(Short Answer)
4.7/5 (28)
SCENARIO 15-6 Given below are results from the regression analysis on 40 observations where the dependent variable is the number of weeks a worker is unemployed due to a layoff and the independent variables are the age of the worker , the number of years of education received , the number of years at the previous job , a dummy variable for marital status ( married, otherwise), a dummy variable for head of household yes, no) and a dummy variable for management position yes, no .
The coefficient of multiple determination for the regression model using each of the 6 variables as the dependent variable and all other variables as independent variables are, respectively, and .
The partial results from best-subset regression are given below:
Model R Square Adj. R Square Std. Error X1X5X6 0.4568 0.4116 18.3534 X1X2X5X6 0.4697 0.4091 18.3919 X1X3X5X6 0.4691 0.4084 18.4023 X1X2X3X5X6 0.4877 0.4123 18.3416 X1X2X3X4X5X6 0.4949 0.4030 18.4861
-Referring to Scenario 15-6, the variable X6 should be dropped to remove
collinearity?
(Short Answer)
4.9/5 (35)
SCENARIO 15-7-B
You are the CEO of a dairy company. You are planning to expand milk production by purchasing
additional cows, lands and hiring more workers. From the existing 50 farms owned by the company,
you have collected data on total milk production (in liters), the number of milking cows, land size (in
acres) and the number of laborers. The data are shown below and also available in the Excel file
Scenario15-7-DataB.XLSX.
You believe that the number of milking cows , land size and the number of laborers are the best predictors for total milk production on any given farm.
-Referring to Scenario 15-7-B, what is your decision on testing whether the quadratic term for
the number of laborers is statistically significant at the 10% level of significance after you have
performed a multiple regression that includes the quadratic terms for the number of milking cows,
land size and the number of laborers?
(Short Answer)
4.7/5 (31)
SCENARIO 15-6 Given below are results from the regression analysis on 40 observations where the dependent variable is the number of weeks a worker is unemployed due to a layoff and the independent variables are the age of the worker , the number of years of education received , the number of years at the previous job , a dummy variable for marital status ( married, otherwise), a dummy variable for head of household yes, no) and a dummy variable for management position yes, no .
The coefficient of multiple determination for the regression model using each of the 6 variables as the dependent variable and all other variables as independent variables are, respectively, and .
The partial results from best-subset regression are given below:
Model R Square Adj. R Square Std. Error X1X5X6 0.4568 0.4116 18.3534 X1X2X5X6 0.4697 0.4091 18.3919 X1X3X5X6 0.4691 0.4084 18.4023 X1X2X3X5X6 0.4877 0.4123 18.3416 X1X2X3X4X5X6 0.4949 0.4030 18.4861
-Referring to Scenario 15-6, there is reason to suspect collinearity between some
pairs of predictors based on the values of the variance inflationary factor.
(True/False)
4.8/5 (28)
SCENARIO 15-7-A
You are the CEO of a dairy company. You are planning to expand milk production by purchasing
additional cows, lands and hiring more workers. From the existing 50 farms owned by the company,
you have collected data on total milk production (in liters), the number of milking cows, land size (in
acres) and the number of laborers. The data are shown below and also available in the Excel file
Scenario15-7-DataA.XLSX. You believe that the number of milking cows , land size and the number of laborers are the best predictors for total milk production on any given farm.
-Referring to Scenario 15-7-A, what is your decision on testing whether the quadratic term for
land size is statistically significant at the 10% level of significance after you have performed a
multiple regression that includes the quadratic terms for the number of milking cows, land size
and the number of laborers?
(Short Answer)
4.8/5 (38)
SCENARIO 15-7-B
You are the CEO of a dairy company. You are planning to expand milk production by purchasing
additional cows, lands and hiring more workers. From the existing 50 farms owned by the company,
you have collected data on total milk production (in liters), the number of milking cows, land size (in
acres) and the number of laborers. The data are shown below and also available in the Excel file
Scenario15-7-DataB.XLSX.
You believe that the number of milking cows , land size and the number of laborers are the best predictors for total milk production on any given farm.
-Referring to Scenario 15-7-B, the model that includes only should be
selected using the adjusted statistic.
(True/False)
4.7/5 (37)
The stepwise regression approach takes into consideration all possible models.
(True/False)
4.8/5 (31)
SCENARIO 15-1
A certain type of rare gem serves as a status symbol for many of its owners. In theory, for low prices,
the demand increases and it decreases as the price of the gem increases. However, experts
hypothesize that when the gem is valued at very high prices, the demand increases with price due to
the status owners believe they gain in obtaining the gem. Thus, the model proposed to best explain
the demand for the gem by its price is the quadratic model: where Y = demand (in thousands) and X = retail price per carat.
This model was fit to data collected for a sample of 12 rare gems of this type. A portion of the
computer analysis obtained from Microsoft Excel is shown below: 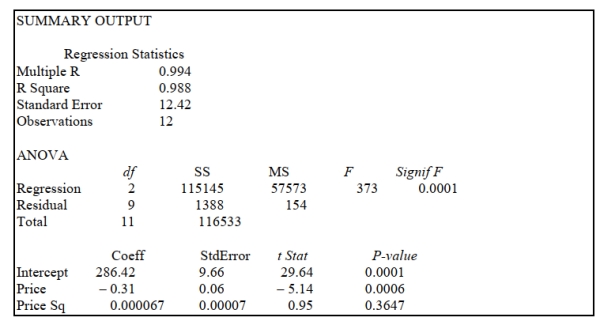 -Referring to Scenario 15-1, what is the value of the test statistic for testing whether there is an upward curvature in the response curve relating the demand (Y) and the price (X)?
(Multiple Choice)
5.0/5 (31)
SCENARIO 15-1
A certain type of rare gem serves as a status symbol for many of its owners. In theory, for low prices,
the demand increases and it decreases as the price of the gem increases. However, experts
hypothesize that when the gem is valued at very high prices, the demand increases with price due to
the status owners believe they gain in obtaining the gem. Thus, the model proposed to best explain
the demand for the gem by its price is the quadratic model: where Y = demand (in thousands) and X = retail price per carat.
This model was fit to data collected for a sample of 12 rare gems of this type. A portion of the
computer analysis obtained from Microsoft Excel is shown below:
-Referring to Scenario 15-1, a more parsimonious simple linear model is likely to
be statistically superior to the fitted curvilinear for predicting sale price (Y).
(True/False)
4.8/5 (34)
Filters
- Essay(0)
- Multiple Choice(0)
- Short Answer(0)
- True False(0)
- Matching(0)