Exam 12: Chi-Square and Nonparametric
Exam 1: Defining and Collecting Data202 Questions
Exam 2: Organizing and Visualizing256 Questions
Exam 3: Numerical Descriptive Measures217 Questions
Exam 4: Basic Probability167 Questions
Exam 5: Discrete Probability Distributions165 Questions
Exam 6: The Normal Distribution and Other Continuous Distributions170 Questions
Exam 7: Sampling Distributions165 Questions
Exam 8: Confidence Interval Estimation219 Questions
Exam 9: Fundamentals of Hypothesis Testing: One-Sample Tests194 Questions
Exam 10: Two-Sample Tests240 Questions
Exam 11: Analysis of Variance170 Questions
Exam 12: Chi-Square and Nonparametric188 Questions
Exam 13: Simple Linear Regression243 Questions
Exam 14: Introduction to Multiple394 Questions
Exam 15: Multiple Regression146 Questions
Exam 16: Time-Series Forecasting235 Questions
Exam 17: Getting Ready to Analyze Data386 Questions
Exam 18: Statistical Applications in Quality Management159 Questions
Exam 19: Decision Making126 Questions
Exam 20: Probability and Combinatorics421 Questions
Select questions type
SCENARIO 12-6
According to an article in Marketing News, fewer checks are being written at the grocery store
checkout than in the past. To determine whether there is a difference in the proportion of shoppers
who pay by check among three consecutive years at a 0.05 level of significance, the results of a
survey of 500 shoppers in three consecutive years are obtained and presented below. 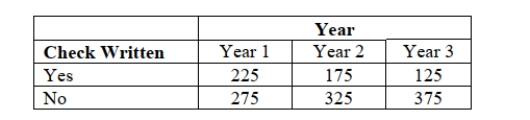 -Referring to Scenario 12-6, there is insufficient evidence to conclude that the
proportions between year 1 and year 3 are different at a 0.05 level of significance.
-Referring to Scenario 12-6, there is insufficient evidence to conclude that the
proportions between year 1 and year 3 are different at a 0.05 level of significance.
(True/False)
4.9/5  (39)
(39)
SCENARIO 12-7
Data on the percentage of 200 hotels in each of the three large cities across the world on whether
minibar charges are correctly posted at checkout are given below. Hong Kong New York Paris Yes 86\% 76\% 78\% No 14\% 24\% 22\% At the 0.05 level of significance, you want to know if there is evidence of a difference in the
proportion of hotels that correctly post minibar charges among the three cities.
-Referring to Scenario 12-7, the decision made suggests that the 3 cities do not all
have the same proportion of hotels that correctly post minibar charges.
(True/False)
4.8/5 (47)
SCENARIO 12-15
Two new different models of compact SUVs have just arrived at the market. You are interested in
comparing the gas mileage performance of both models to see if they are the same. A partial
computer output for twelve compact SUVs of model 1 and thirteen of model 2 is given below: 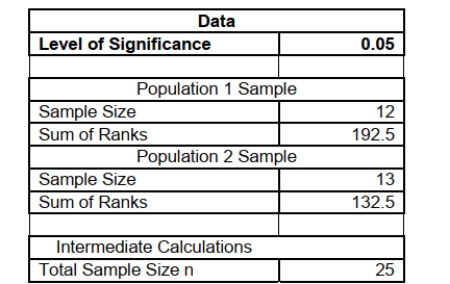 You are told that the gas mileage population distributions for both models are not normally
distributed.
-Referring to Scenario 12-15, what is the value of the Wilcoxon rank sum test statistic T1?
You are told that the gas mileage population distributions for both models are not normally
distributed.
-Referring to Scenario 12-15, what is the value of the Wilcoxon rank sum test statistic T1?
(Short Answer)
4.7/5 (48)
SCENARIO 12-13
Recent studies have found that American children are more obese than in the past. The amount of
time children spent watching television has received much of the blame. A survey of 100 ten-year-
olds revealed the following with regards to weights and average number of hours a day spent
watching television. We are interested in testing whether the mean number of hours spent watching
TV and weights are independent at 1% level of significance. 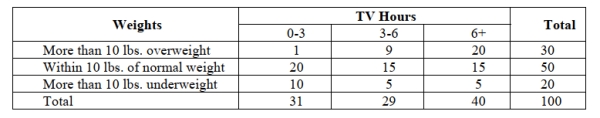 -Referring to Scenario 12-13, if there is no connection between weights and average number of hours spent watching TV, we should expect how many children to be spending 3-6 hours on
Average watching TV and are more than 10 lbs. underweight?
-Referring to Scenario 12-13, if there is no connection between weights and average number of hours spent watching TV, we should expect how many children to be spending 3-6 hours on
Average watching TV and are more than 10 lbs. underweight?
(Multiple Choice)
4.8/5 (50)
SCENARIO 12-12
Parents complain that children read too few storybooks and watch too much television nowadays. A
survey of 1,000 children reveals the following information on average time spent watching TV and
average time spent reading storybooks 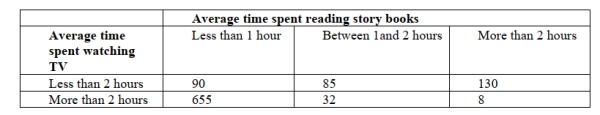 -Referring to Scenario 12-12, we want to test whether there is any relationship between average time spent watching TV and average time spent reading storybooks. Suppose the value of the test
Statistic was 164 (which is not the correct answer) and the critical value was 19.00 (which is not
The correct answer), then we could conclude that
-Referring to Scenario 12-12, we want to test whether there is any relationship between average time spent watching TV and average time spent reading storybooks. Suppose the value of the test
Statistic was 164 (which is not the correct answer) and the critical value was 19.00 (which is not
The correct answer), then we could conclude that
(Multiple Choice)
4.9/5 (51)
SCENARIO 12-12
Parents complain that children read too few storybooks and watch too much television nowadays. A
survey of 1,000 children reveals the following information on average time spent watching TV and
average time spent reading storybooks
-Referring to Scenario 12-12, suppose we want to constrain the probability of committing a Type I error to 5% when testing whether there is any relationship between average time spent
Watching TV and average time spent reading story books, the critical value will be
(Multiple Choice)
4.9/5 (33)
SCENARIO 12-18
A consulting firm that surveyed consumers' holiday shopping behavior found that the percentage of
consumers from the U.S., Canada, and China who said that they planned to spend more on holiday
shopping were 40%, 34% and 72%, respectively. Random samples of size 150 are selected from each
of the three countries.
You want to test for evidence of a difference among the proportions across the three countries using
the 0.05 level of significance.
-Referring to Scenario 12-18, the expected cell frequency for "planned to spend more on holiday
shopping" for the U.S. is __________.
(Short Answer)
4.9/5 (29)
When using the tests for independence, you should be aware that expected
frequencies that are too small will lead to a large Type I error.
(True/False)
4.9/5 (32)
SCENARIO 12-18
A consulting firm that surveyed consumers' holiday shopping behavior found that the percentage of
consumers from the U.S., Canada, and China who said that they planned to spend more on holiday
shopping were 40%, 34% and 72%, respectively. Random samples of size 150 are selected from each
of the three countries.
You want to test for evidence of a difference among the proportions across the three countries using
the 0.05 level of significance.
-Referring to Scenario 12-18, the value of the test statistic is _________.
(Short Answer)
4.8/5 (39)
SCENARIO 12-15
Two new different models of compact SUVs have just arrived at the market. You are interested in
comparing the gas mileage performance of both models to see if they are the same. A partial
computer output for twelve compact SUVs of model 1 and thirteen of model 2 is given below: You are told that the gas mileage population distributions for both models are not normally
distributed.
-Referring to Scenario 12-15, what is your decision on the test using a 5% level of significance?
(Short Answer)
4.8/5 (38)
SCENARIO 12-6
According to an article in Marketing News, fewer checks are being written at the grocery store
checkout than in the past. To determine whether there is a difference in the proportion of shoppers
who pay by check among three consecutive years at a 0.05 level of significance, the results of a
survey of 500 shoppers in three consecutive years are obtained and presented below.
-Referring to Scenario 12-6, what are the degrees of freedom of the test statistic?
(Short Answer)
4.8/5 (38)
SCENARIO 12-15
Two new different models of compact SUVs have just arrived at the market. You are interested in
comparing the gas mileage performance of both models to see if they are the same. A partial
computer output for twelve compact SUVs of model 1 and thirteen of model 2 is given below: You are told that the gas mileage population distributions for both models are not normally
distributed.
-Referring to Scenario 12-15, what should be the null and alternative hypotheses of the test? a) vs.
b) vs.
c) vs.
d) vs.
(Short Answer)
4.8/5 (34)
SCENARIO 12-7
Data on the percentage of 200 hotels in each of the three large cities across the world on whether
minibar charges are correctly posted at checkout are given below. Hong Kong New York Paris Yes 86\% 76\% 78\% No 14\% 24\% 22\% At the 0.05 level of significance, you want to know if there is evidence of a difference in the
proportion of hotels that correctly post minibar charges among the three cities.
-Referring to Scenario 12-7, the critical value of the test is ________.
(Short Answer)
4.7/5 (30)
SCENARIO 12-18
A consulting firm that surveyed consumers' holiday shopping behavior found that the percentage of
consumers from the U.S., Canada, and China who said that they planned to spend more on holiday
shopping were 40%, 34% and 72%, respectively. Random samples of size 150 are selected from each
of the three countries.
You want to test for evidence of a difference among the proportions across the three countries using
the 0.05 level of significance.
-Referring to Scenario 12-18, there is sufficient evidence to conclude that the
proportions between Canada and China are different at a 0.05 level of significance.
(True/False)
4.9/5 (30)
SCENARIO 12-5
Four surgical procedures currently are used to install pacemakers. If the patient does not need to
return for follow-up surgery, the operation is called a "clear" operation. A heart center wants to
compare the proportion of clear operations for the 4 procedures, and collects the following numbers
of patients from their own records:
A B C D Total Clear 27 41 21 7 96 Return 11 15 9 11 46 Total 38 56 30 18 142 They will use this information to test for a difference among the proportion of clear operations using
a chi-square test with a level of significance of 0.05.
-Referring to Scenario 12-5, the overall or mean proportion of clear operations is __________.
(Short Answer)
4.8/5 (31)
SCENARIO 12-1 A corporation randomly selects 150 salespeople and finds that who have never taken a selfimprovement course would like such a course. The firm did a similar study 10 years ago in which of a random sample of 160 salespeople wanted a self-improvement course. The groups are assumed to be independent random samples. Let and represent the true proportion of workers who would like to attend a self-improvement course in the recent study and the past study, respectively.
-Referring to Scenario 12-1, what is the critical value when testing whether the population proportions are different if α = 0.10? a)
b)
c)
d)
(Short Answer)
4.8/5 (40)
SCENARIO 12-7
Data on the percentage of 200 hotels in each of the three large cities across the world on whether
minibar charges are correctly posted at checkout are given below. Hong Kong New York Paris Yes 86\% 76\% 78\% No 14\% 24\% 22\% At the 0.05 level of significance, you want to know if there is evidence of a difference in the
proportion of hotels that correctly post minibar charges among the three cities.
-Referring to Scenario 12-7, what are the values of the absolute difference and the critical range
for the Marascuilo procedure to test for the difference in proportions between Hong Kong and
Paris using a 0.05 level of significance?
(Short Answer)
4.8/5 (29)
SCENARIO 12-16
As part of an evaluation program, a sporting goods retailer wanted to compare the downhill coasting
speeds of 4 brands of bicycles. She took 3 of each brand and determined their maximum downhill
speeds. The results are presented in miles per hour in the table below. 1 43 37 41 43 2 46 38 45 45 3 43 39 42 46
-Referring to Scenario 12-16, the decision rule for a level of significance of 0.05 using the
Kruskal-Wallis test is to reject the null hypothesis if the test statistic H is ________ assuming that
the sample sizes were large enough to use a chi-square approximation.
(Short Answer)
4.9/5 (39)
When the parametric assumption on the distribution is met, a parametric test is
usually more powerful than a nonparametric test.
(True/False)
4.7/5 (46)
SCENARIO 12-3
The director of transportation of a large company is interested in the usage of her van pool. She
considers her routes to be divided into local and non-local. She is particularly interested in learning if
there is a difference in the proportion of males and females who use the local routes. She takes a
sample of a day's riders and finds the following: Male Female Total Local 27 44 71 Non-Local 33 25 58 Total 60 69 129 She will use this information to perform a chi-square hypothesis test using a level of significance of
0.05.
-Referring to Scenario 12-3, the expected cell frequency in the Male/Local cell is __________.
(Short Answer)
4.9/5 (37)
Filters
- Essay(0)
- Multiple Choice(0)
- Short Answer(0)
- True False(0)
- Matching(0)