Exam 2: Displaying and Describing Data
Exam 1: Stats Starts Here18 Questions
Exam 2: Displaying and Describing Data24 Questions
Exam 3: Relationships Between Categorical Variablescontingency Tables29 Questions
Exam 4: Understanding and Comparing Distributions28 Questions
Exam 5: The Standard Deviation As a Ruler and the Normal Model29 Questions
Exam 6: Scatterplots, Association, and Correlation26 Questions
Exam 7: Linear Regression30 Questions
Exam 8: Regression Wisdom18 Questions
Exam 9: Multiple Regression16 Questions
Exam 10: Sample Surveys28 Questions
Exam 11: Experiments and Observational Studies20 Questions
Exam 12: From Randomness to Probability20 Questions
Exam 13: Sampling Distribution Models and Confidence Intervals for Proportions20 Questions
Exam 14: Confidence Intervals for Means19 Questions
Exam 15: Testing Hypotheses17 Questions
Exam 16: More About Tests and Intervals20 Questions
Exam 17: Comparing Groupspaired16 Questions
Exam 18: Samples and Blocks14 Questions
Exam 19: Comparing Counts20 Questions
Select questions type
 The most appropriate measure of central tendency for these data is the
Free
(Multiple Choice)
4.8/5  (36)
(36)
Correct Answer: Verified
A
Suppose that the student taking 22 credit hours in the data set in the previous question was
actually taking 28 credit hours instead of 22 (so we would replace the 22 in the data set with
28).
Indicate whether changing the number of credit hours for that student would make each
of the following summary statistics increase, decrease, or stay about the same:
a. mean _____
b. median______
c. range__________
d. IQR________
e. standard deviation_________
Free
(Essay)
4.8/5 (35)
Correct Answer:Verified
a. mean
increase
b. median
stay about the same
c. range
increase
d. IQR
stay about the same
e. standard deviation
increase
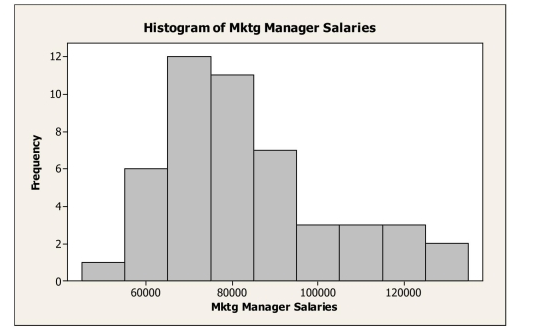
Below is a histogram of salaries (in $) for a sample of U.S.marketing managers.  The shape of this distribution is
Free
(Multiple Choice)
4.8/5 (42)
Correct Answer:Verified
C
All students in a physical education class completed a basketball free-throw shooting event
and the highest number of shots made was 32.The next day a student who had just transferred into the school completed the event, making 35 shots.Indicate whether adding the new student's score to the rest of the data made each of these summary statistics increase, decrease, or stay about the same:
a. mean______
b. median____
c. range________
d. IQR__________
e. standard deviation__________
(Essay)
4.8/5 (41)
Students in a statistics course were asked to Superpower Num of Students Fly 19 Freeze Time 11 Invisibility 7 Super strength 4 Telepathy 12
Superpower.Results are listed to the right.
A.Create a visual display for these data.
B.Describe the distribution of the students' choices.
(Essay)
4.9/5 (38)
The following table shows total assets ($ billion) for a small sample of U.S.banks. BANK ASSETS (\ billion) Bank of New York 88 Regions Financial 80 Fifth Third Bank 58 State Street Bank and Trust 92 Branch Banking and Trust Company 81 Chase Bank 70 Key Bank 89 PNC Bank 84 The standard deviation for these data is
(Multiple Choice)
4.8/5 (42)
The following table shows data for total assets ($ billion) for a small sample of U.S.banks
(late 2013). BANK ASSETS (\ billion) State Street Bank and Trust 160.5 Discover Bank 63.9 BancWest 72.8 Citizens Bank 130.0 Northern Trust 83.8 Huntington Bank 53.8 Key Bank 91.8 People's United 27.9
The mean for the total assets data ($ billion) is
(Multiple Choice)
4.9/5 (28)
Describe why the area principle is important in making a bar graph.It might be fun to ask an
artist to liven up a bar graph by turning the bars into images.But include in your explanation
why this might be risky.
(Essay)
4.8/5 (42)
A restaurant uses comment cards to get feedback from its customers about newly added items
To the menu.It recently introduced homemade organic veggie burgers.Customers who tried
The new burger were asked if they would order it again.The data are summarized in the table
Below.What percentage of customers would most likely or definitely order the veggie
Burger again?
Response Frequency Definitely would. 10 Most likely would. 40 Maybe 12 Definitely would not. 3
(Multiple Choice)
5.0/5 (41)
The following table shows total assets ($ billion) for a small sample of U.S.banks. BANK ASSETS (\ billion) Bank of New York 88 Regions Financial 80 Fifth Third Bank 58 State Street Bank and Trust 92 Branch Banking and Trust Company 81 Chase Bank 70 Key Bank 89 PNC Bank 84 The mean for these data is
(Multiple Choice)
4.9/5 (40)
Consider the five number summary of hourly wages ($) for a sample of sales managers. Min Q1 Median Q3 Max 20.94 37.64 44.77 49.34 67.11 The IQR for these data is
(Multiple Choice)
4.8/5 (44)
The students in a biology class kept a record of the height
49 67 38 55 62 54 36 41 56 43 48 75 44 60 48 52 48 53 59 32
a.Sketch a histogram for these datA.
b.Find the mean and standard deviation of the plant heights.
c. Is it appropriate to use the mean and standard deviation to summarize these data? Explain.
d. Describe the distribution of plant heights.
(Essay)
4.9/5 (40)
A survey conducted in a college intro stats class 10 10 12 14 15 15 15 15 17 17 19 20 20 20 20 22
asked students about the number of credit hours
they were taking that quarter.The number of
credit hours for a random sample of 16 students is
given in the table.
a.Sketch a histogram of these data
b.Find the mean and standard deviation for
the number of credit hours.
c. Find the median and IQR for the number
d. Is it more appropriate to use the mean of credit hours. and standard deviation or the median and IQR to summarize theses data?
(Essay)
4.8/5 (35)
Consider the five number summary of hourly wages ($) for a sample of sales managers.
Suppose the mean hourly wage is $38.50.What can we say about the shape of the
Distribution? Min Q1 Median Q3 Max 20.94 37.64 44.77 49.34 67.11
(Multiple Choice)
4.8/5 (35)
A clothing store uses comment cards to get feedback from its customers about newly added
Items.It recently introduced plus size fashion wear.Customers who purchased the items
Were asked to fill out an online comment survey giving 10% off the next purchasE.The data
Are summarized in the table below.What percentage of customers were at least satisfied with
The item(s) purchased (Satisfied or Very satisfied)? Response Frequency Very satisfied. 15 Satisfied. 30 Less than fully satisfied. 12 Not satisfied. 4
(Multiple Choice)
4.7/5 (39)
Here is the five number summary for salaries of U.S.marketing managers.
The IQR is Min Q1 Median Q3 Max 46360 69693 77020 91750 129420
(Multiple Choice)
4.8/5 (35)
Consider the five number summary of hourly wages ($) for a sample of advertising /
Promotion managers. Min Q1 Median Q3 Max 19.64 29.36 34.18 40.86 57.26
Suppose there had been an error and that the lowest hourly wage was $15.50 instead of
$19)64.This would result in
(Multiple Choice)
4.9/5 (32)
A brake and muffler shop reported the repair bills, in
88 283 312 290 172 154 400 381 346 181 203 118 143 252 227 56 192 292 213 422
a.Sketch a histogram for these datA.
b.Find the mean and standard deviation of the repair costs.
c. Is it appropriate to use the mean and standard deviation to summarize these
data? Explain.
d. Describe the distribution of repair costs.
(Essay)
4.9/5 (46)
A automobile marketing firm conducts a study to see what types of cars people owned before Buying an American car.The results are shown below. Previous Ownership Frequency American 760 Japanese 375 Korean 72 German 37 Other 24 Total
The relative frequency of those who owned Japanese cars previously who now bought
American cars is
(Multiple Choice)
4.9/5 (40)
Consider the five number summary of hourly wages ($) for a sample of sales managers. Min 1 Median 3 Max 20.94 37.64 44.77 49.34 67.11 The range for these data is
(Multiple Choice)
4.9/5 (37)
Filters
- Essay(0)
- Multiple Choice(0)
- Short Answer(0)
- True False(0)
- Matching(0)