Exam 4: Understanding and Comparing Distributions
Exam 1: Stats Starts Here18 Questions
Exam 2: Displaying and Describing Data24 Questions
Exam 3: Relationships Between Categorical Variablescontingency Tables29 Questions
Exam 4: Understanding and Comparing Distributions28 Questions
Exam 5: The Standard Deviation As a Ruler and the Normal Model29 Questions
Exam 6: Scatterplots, Association, and Correlation26 Questions
Exam 7: Linear Regression30 Questions
Exam 8: Regression Wisdom18 Questions
Exam 9: Multiple Regression16 Questions
Exam 10: Sample Surveys28 Questions
Exam 11: Experiments and Observational Studies20 Questions
Exam 12: From Randomness to Probability20 Questions
Exam 13: Sampling Distribution Models and Confidence Intervals for Proportions20 Questions
Exam 14: Confidence Intervals for Means19 Questions
Exam 15: Testing Hypotheses17 Questions
Exam 16: More About Tests and Intervals20 Questions
Exam 17: Comparing Groupspaired16 Questions
Exam 18: Samples and Blocks14 Questions
Exam 19: Comparing Counts20 Questions
Select questions type
The side-by-side boxplots show the cumulative college GPAs for sophomores, juniors, and seniors taking an intro stats course in Autumn 2012.
 a.Which class (sophomore, junior, or senior) had the lowest cumulative college GPA?
What is the approximate value of that GPA?
b.Which class has the highest median GPA, and what is that GPA?
c.Which class has the largest range for GPA, and
what is it?
d.Which class has the most symmetric set of GPAs?
The most skewed set of GPAs?
a.Which class (sophomore, junior, or senior) had the lowest cumulative college GPA?
What is the approximate value of that GPA?
b.Which class has the highest median GPA, and what is that GPA?
c.Which class has the largest range for GPA, and
what is it?
d.Which class has the most symmetric set of GPAs?
The most skewed set of GPAs?
Free
(Essay)
4.8/5  (39)
(39)
Correct Answer: Verified
a.The junior class had the lowest cumulative GPA, around 1.6
b.The sophomore class had the highest median cumulative GPA, around 3.2
c.The junior class had the largest range for GPA, about 2.4
d.The senior class had the most symmetric set of GPAs. The sophomore class had the most skewed set of GPAs, skewed to the left
The boxplots show prices of used cars (in thousands of dollars) advertised for sale at three
Different car dealers.Which dealer has the smallest price range, and what is it?

Free
(Multiple Choice)
4.8/5 (37)
Correct Answer:Verified
C
The boxplots show prices of used cars (in thousands of dollars) advertised for sale at three different car dealers.
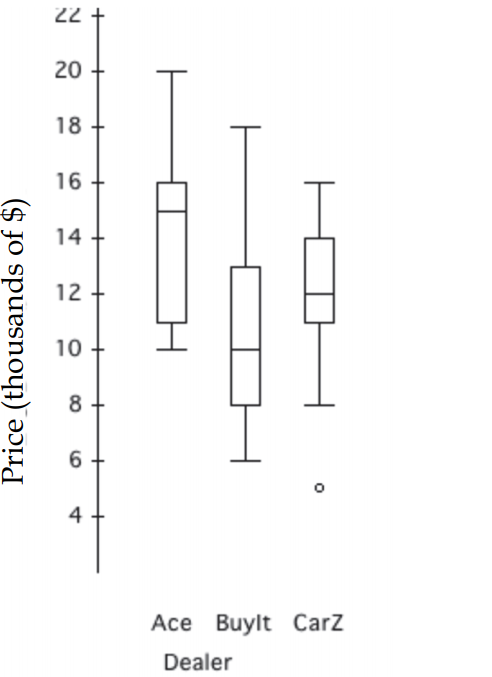 a. Which dealer offers the cheapest car offered, and at what price?
b. Which dealer has the lowest median price, and how much is it?
c. Which dealer has the smallest price range, and what is it?
d. Which dealer's prices have the smallest IQR, and what is it?
e. Which dealer generally sells cars cheapest? Explain.
a. Which dealer offers the cheapest car offered, and at what price?
b. Which dealer has the lowest median price, and how much is it?
c. Which dealer has the smallest price range, and what is it?
d. Which dealer's prices have the smallest IQR, and what is it?
e. Which dealer generally sells cars cheapest? Explain.
Free
(Essay)
4.9/5 (38)
Correct Answer:Verified
a.Car Z:$5000
b.BuyIt:$10,000
c.Ace: $10,000
d.CarZ:$3000
e.BuyIt; half of their cars are cheaper than any of the cars at Ace, and 25% of their cars are cheaper than all but one car at CarZ. The third quartile of their prices is well below the third quartile at CarZ, and below even the median price at Ace
The boxplots show prices of used cars (in thousands of dollars) advertised for sale at three
Different car dealers.Which dealer's prices have the smallest IQR, and what is it?

(Multiple Choice)
4.9/5 (43)
The following boxplots show monthly sales revenue figures ($ thousands) for a discount
Office supply company with locations in three different regions of the U.S.(Northeast,
Southeast, and West).Which of the following statements is false? 
(Multiple Choice)
4.8/5 (37)
At www.census.gov you can create a "population pyramid" for any country.These pyramids Are back-to-back histograms.This pyramid shows Mexico's 2000 female population and the Census bureau's projection for 2050.Check all that apply. 
(Multiple Choice)
4.8/5 (35)
The body temperature of students is taken each time a student goes to the nurse's office.The five-number summary for the temperatures (in degrees Fahrenheit) of students on a particular day is:
Min Q1 Median Q3 Max 96. 97.8 98.2 98. 101.
a.Would you expect the mean temperature of all students who visited the nurse's office to be higher or lower than the median? Explain.
b. After the data were picked up in the afternoon, three more students visited the nurse’s
office with temperatures of 96.7º, 98.4º, and 99.2º. Were any of these students outliers?
Explain.
(Essay)
4.9/5 (44)
The boxplots show prices of used cars (in thousands of dollars) advertised for sale at three Different car dealers.Which dealer generally sells cars cheapest?

(Multiple Choice)
4.8/5 (30)
The boxplots show prices of used cars (in thousands of dollars) advertised for sale at three
Different car dealers.Which dealer has the lowest median price, and how much is it?

(Multiple Choice)
4.9/5 (32)
The five-number summary for midterm scores (number of points; the maximum possible
score was 50 points) from an intro stats class is:
Min Q1 Median Q3 Max 16.5 32 39 43.5 48.5
a. Would you expect the mean midterm score of all students who took the midterm to be
higher or lower than the median? Explain.
b. Based on the five-number summary, are any of the midterm scores outliers? Explain.
(Essay)
4.8/5 (32)
The side-by-side boxplots show the cumulative college GPAs for sophomores, juniors, and
Seniors taking an intro stats course in Autumn 2003.
 Which class has the largest range for GPA?
(Multiple Choice)
4.9/5 (35)
The side-by-side boxplots show the cumulative college GPAs for sophomores, juniors, and Seniors taking an intro stats course in Autumn 2003.  Which class has the highest median GPA?
(Multiple Choice)
4.8/5 (38)
One thousand students from a local university were sampled to gather information such as gender, high school GPA, college GPA, and total SAT scores. The results were used to create histograms displaying high school grade point averages (GPA’s) for both males and females. Compare the grade distribution of males and females.

(Essay)
4.9/5 (39)
At www.census.gov you can create a "population pyramid" for any country.These pyramids Are back-to-back histograms.This pyramid shows Mexico's 2000 female population and the Census bureau's projection for 2050.Check all that apply. 
(Multiple Choice)
4.9/5 (41)
How do sports salaries compare? Two sets of histograms below show the distributions of Salaries for Major League Baseball and the National Football League.What set of histograms Makes it easier to compare the distributions? And for what reasons? Check all that apply.

(Multiple Choice)
4.8/5 (42)
One thousand students from a local university were sampled to gather information such as
Gender, high school GPA, college GPA, and total SAT scores.The results were used to create Histograms displaying high school grade point averages (GPAs) for both males and females. Compare the grade distribution of males and females.Check all that apply. 
(Multiple Choice)
4.8/5 (49)
On the right are two dotplots made for the heights of 200 randomly chosen students. The heights are separated by gender. Describe and compare the distributions 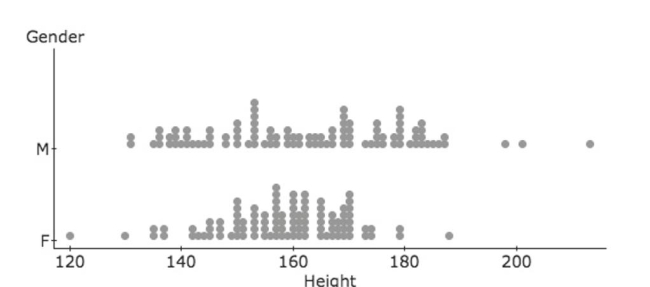
(Essay)
4.8/5 (32)
The side-by-side boxplots show the cumulative college GPAs for sophomores, juniors, and Seniors taking an intro stats course in Autumn 2003.
What is approximately the GPA of  The class with the highest m edian GPA?
(Multiple Choice)
4.8/5 (36)
At www.census.gov you can create a "population pyramid" for any country.These pyramids are back-to-back histograms.This pyramid shows Mexico's 2000 female population and the census bureau's projection for 2050.Write a few sentences summarizing the changes that are forecast. 
(Essay)
5.0/5 (42)
The side-by-side boxplots show the cumulative college GPAs for sophomores, juniors, and Seniors taking an intro stats course in Autumn 2003.
 In which class (sophomore, junior, or senior) do you find the student with the lowest Cumulative college GPA?
(Multiple Choice)
4.9/5 (30)
Filters
- Essay(0)
- Multiple Choice(0)
- Short Answer(0)
- True False(0)
- Matching(0)