Exam 9: Multiple Regression
Exam 1: Stats Starts Here18 Questions
Exam 2: Displaying and Describing Data24 Questions
Exam 3: Relationships Between Categorical Variablescontingency Tables29 Questions
Exam 4: Understanding and Comparing Distributions28 Questions
Exam 5: The Standard Deviation As a Ruler and the Normal Model29 Questions
Exam 6: Scatterplots, Association, and Correlation26 Questions
Exam 7: Linear Regression30 Questions
Exam 8: Regression Wisdom18 Questions
Exam 9: Multiple Regression16 Questions
Exam 10: Sample Surveys28 Questions
Exam 11: Experiments and Observational Studies20 Questions
Exam 12: From Randomness to Probability20 Questions
Exam 13: Sampling Distribution Models and Confidence Intervals for Proportions20 Questions
Exam 14: Confidence Intervals for Means19 Questions
Exam 15: Testing Hypotheses17 Questions
Exam 16: More About Tests and Intervals20 Questions
Exam 17: Comparing Groupspaired16 Questions
Exam 18: Samples and Blocks14 Questions
Exam 19: Comparing Counts20 Questions
Select questions type
In regression an observation has high leverage when
Free
(Multiple Choice)
4.8/5  (27)
(27)
Correct Answer: Verified
A
Selling price and amount spent advertising were entered into a multiple regression to Determine what affects flat panel LCD TV sales.The regression coefficient for Price was Found to be -0.03055, which of the following is the correct interpretation for this value?
Free
(Multiple Choice)
4.8/5 (35)
Correct Answer:Verified
C
Selling price and amount spent advertising were entered into a multiple regression to determine what affects flat panel LCD TV sales. The adjusted value was reported as . This means that
Free
(Multiple Choice)
4.7/5 (35)
Correct Answer:Verified
D
Selling price and amount spent advertising were entered into a multiple regression to
Determine what affects flat panel LCD TV sales.Use the output shown below, calculate the
Amount of variability in Sales is explained by the estimated multiple regression model.
Source DF SS MS Regression 2 16477.3 8238.7 Residual Error 27 3038.0 112.5 Total 29 19515.4
(Multiple Choice)
4.9/5 (34)
A sample of 33 companies was randomly selected and data collected on the average annual Bonus, turnover rate (%), and trust index (measured on a scale of 0 - 100).According to the Output below, what is the F statistic to determine the overall significance of the estimated is?
Source DF SS MS Regression 2 262.73 131.36 Residual Error 30 67.27 2.24 Total 32 330.00
(Multiple Choice)
4.8/5 (46)
Using the output below, calculate the predicted turnover rate for a company having a trust Index score of 70 and an average annual bonus of $6500.
Predictor Coef SE Coef T P Constant 2.1005 0.7826 15.46 0.000 Trust Index -0.07149 0.01966 -3.64 0.001 Average Bonus -0.0007216 0.0001481 -4.87 0.000
(Multiple Choice)
4.8/5 (45)
A sample of 33 companies was randomly selected and data collected on the average annual
Bonus, turnover rate (%), and trust index (measured on a scale of 0 - 100).According to the
Output is shown below, what is the estimated multiple regression model? Response Variable is Turnover Rate
Predictor Coef SE Coef T P Constant 12.1005 0.7826 15.46 0.000 Trust Index -0.07149 0.01966 -3.64 0.001 Average Bonus -0.0007216 0.0001481 -4.87 0.000
(Multiple Choice)
4.8/5 (36)
Selling price and amount spent advertising were entered into a multiple regression to Determine what affects flat panel LCD TV sales.The correct null and alternative hypotheses For testing the regression coefficient of Price is
(Multiple Choice)
4.8/5 (29)
Which of the following are NOT characteristics of a good regression model?
(Multiple Choice)
4.9/5 (36)
Selling price and amount spent advertising were entered into a multiple regression to Determine what affects flat panel LCD TV sales.Using the output below, calculated F Statistic to determine the overall significance of the estimated multiple regression model is
Source DF SS MS Regression 2 16477.3 8238.7 Residual Error 27 3038.0 112.5 Total 29 19515.4
(Multiple Choice)
4.9/5 (36)
Selling price and amount spent advertising were entered into a multiple regression to Determine what affects flat panel LCD TV sales.Based on the output below, which of the Following statements is/are true?
Predictor Coef SE Coef T P Constant 90.19 25.08 3.60 0.001 Price -0.03055 0.01005 -3.04 0.005 Advertising 3.0926 0.3680 8.40 0.000
Source DF SS MS Regression 2 16477.3 8238.7 Residual Error 27 3038.0 112.5 Total 29 19515.4
(Multiple Choice)
4.8/5 (45)
A sample of 33 companies was randomly selected and data collected on the average annual Bonus, turnover rate (%), and trust index (measured on a scale of 0 - 100).In a multiple Regression estimating turnover rate using average bonus and trust index, what is the correct Null hypotheses for testing the regression coefficient of Trust Index?
Predictor Coef SE Coef T P Constant 12.1005 0.7826 15.46 0.000 Trust Index -0.07149 0.01966 -3.64 0.001 Average Bonus -0.0007216 0.0001481 -4.87 0.000
(Multiple Choice)
4.9/5 (33)
Selling price and amount spent advertising were entered into a multiple regression to Determine what affects flat panel LCD TV sales.The plot of residuals versus predicted Values is shown below.What does the residual plot suggest? 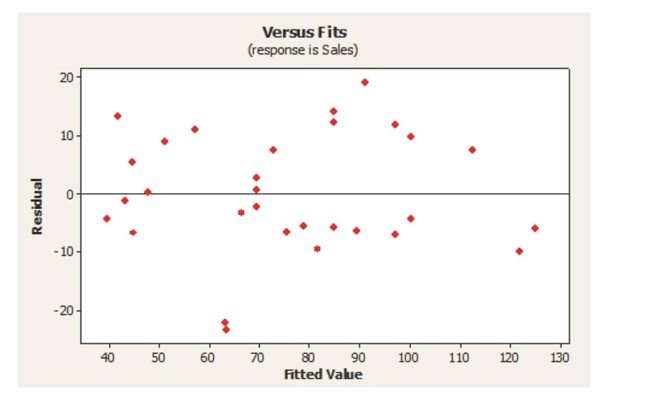
(Multiple Choice)
4.7/5 (30)
A sample of 33 companies was randomly selected and data collected on the average annual Bonus, turnover rate (%), and trust index (measured on a scale of 0 - 100).Using the output Below, and a significance level of ? = .01, we can conclude that
Predictor Coef SE Coef T P Constant 12.1005 0.7826 15.46 0.000 Trust Index -0.07149 0.01966 -3.64 0.001 Average Bonus -0.0007216 0.0001481 -4.87 0.000
Source DF SS MS Regression 2 262.73 131.36 Residual Error 30 67.27 2.24 Total 32 330.00
(Multiple Choice)
4.7/5 (37)
A sample of 33 companies was randomly selected and data collected on the average annual Bonus, turnover rate (%), and trust index (measured on a scale of 0 - 100).Based on the Output, how much of the variability in Turnover Rate is explained by the estimated multiple Regression model?
Predictor Coef SE Coef T P Constant 12.1005 0.7826 15.46 0.000 Trust Index -0.07149 0.01966 -3.64 0.001 Average Bonus -0.0007216 0.0001481 -4.87 0.000
(Multiple Choice)
4.7/5 (38)
Filters
- Essay(0)
- Multiple Choice(0)
- Short Answer(0)
- True False(0)
- Matching(0)