Exam 3: Graphing
Exam 1: Review of Real Numbers490 Questions
Exam 2: Equations, Inequalities, and Problem Solving332 Questions
Exam 3: Graphing313 Questions
Exam 4: Solving Systems of Linear Equations146 Questions
Exam 5: Exponents and Polynomials304 Questions
Exam 6: Factoring Polynomials261 Questions
Exam 7: Rational Expressions327 Questions
Exam 8: More on Functions and Graphs192 Questions
Exam 9: Inequalities and Absolute Value148 Questions
Exam 10: Rational Exponents, Radicals, and Complex Numbers379 Questions
Exam 11: Quadratic Equations and Functions242 Questions
Exam 12: Exponential and Logarithmic Functions302 Questions
Exam 13: Conic Sections153 Questions
Exam 14: Sequences, Series, and the Binomial Theorem201 Questions
Select questions type
Find the slope of the line that passes through the given points.
- and
(Multiple Choice)
4.8/5  (36)
(36)
Graph the linear equation by finding and plotting its intercepts.
-
(Multiple Choice)
4.8/5 (50)
Find an equation for the line. Write the equation in standard form.
-Through and parallel to
(Multiple Choice)
4.8/5 (42)
Find an equation of the line described.
-Through , perpendicular to the -axis
(Multiple Choice)
4.9/5 (43)
The graph below shows the percentage of students enrolled in the College of Engineering at State University. Use the
graph to answer the question. 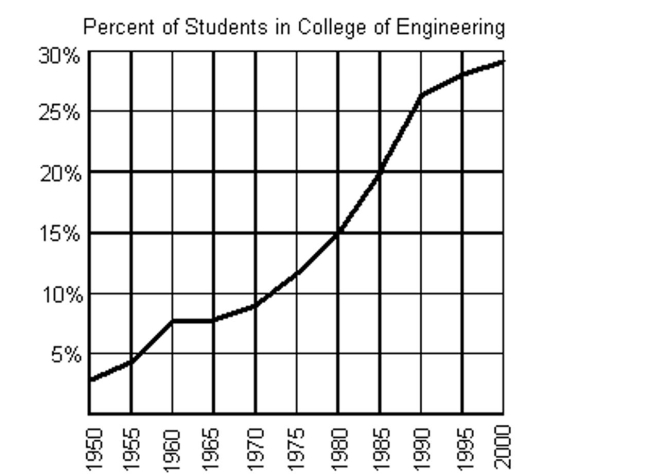 -Approximate the year that 26% of students were enrolled.
(Multiple Choice)
4.8/5 (47)
Given the following function, find the indicated values. Then write the corresponding ordered pairs.
-Find , and when
(Multiple Choice)
4.8/5 (34)
Solve. Assume the exercise describes a linear relationship.
-In 2005, John invested in the stock market. By 2011 his investment had grown to . Find an equation relating time and the value of the investment. If the market continues to grow at the same rate, how much will be in his account in 2018? Give your answer to the nearest dollar.
(Multiple Choice)
5.0/5 (42)
Determine whether the ordered pair is a solution of the given linear equation.
-
(True/False)
4.9/5 (32)
Graph the linear equation by finding and plotting its intercepts.
-
(Multiple Choice)
5.0/5 (36)
Filters
- Essay(0)
- Multiple Choice(0)
- Short Answer(0)
- True False(0)
- Matching(0)