Exam 10: Correlation and Regression
Exam 1: The Nature of Probability and Statistics81 Questions
Exam 2: Frequency Distributions and Graphs107 Questions
Exam 3: Data Description127 Questions
Exam 4: Probability and Counting Rules173 Questions
Exam 5: Discrete Probability Distributions117 Questions
Exam 6: The Normal Distribution114 Questions
Exam 7: Confidence Intervals and Sample Size122 Questions
Exam 8: Hypothesis Testing178 Questions
Exam 9: Testing the Difference Between Two Means, Two Variances, and Two Proportions99 Questions
Exam 10: Correlation and Regression73 Questions
Exam 11: Other Chi-Square Tests73 Questions
Exam 12: Analysis of Variance69 Questions
Exam 13: Nonparametric Statistics62 Questions
Exam 14: Sampling and Simulation58 Questions
Select questions type
In a study of reaction times, the time to respond to a visual stimulus and the time to respond to an auditory stimulus were recorded for each of 8 subjects. Times were measured in thousandths of a second. The results are presented in the following table.
Visual Auditory 218 209 153 150 240 226 202 196 243 225 165 161 207 196 209 198
Compute the least-squares regression line for predicting auditory response time from visual response time .
Free
(Multiple Choice)
4.8/5  (35)
(35)
Correct Answer: Verified
B
Total number of assists and the total number of points or a sample of NHL scoring leader: shown.
Assists x Total Points y 26 48 29 68 32 66 34 69 36 76 37 67 40 84
Predict the total points if assists.
Free
(Multiple Choice)
4.9/5 (40)
Correct Answer:Verified
C
An architect wants to determine the relationship between the height (in feet) and of stories in a building. The data for a sample of 10 buildings in Pittsburgh are sh
a. Draw the scatter plot for the variables.
b. Give a brief explanation of the type of relationship.
Stories x Height y 64 841 54 725 40 635 31 616 45 615 38 582 42 535 41 520 37 511 40 485
(Essay)
4.9/5 (45)
In a study of reaction times, the time to respond to a visual stimulus and the time to respond to an auditory stimulus were recorded for each of 6 subjects. Times were measured in thousandths of a second. The results are presented in the following table.
The following MINITAB output describes the fit of a linear model to these data. Assume assumptions of the linear model are satisfied.
The regression equation is
Auditory Visual
Predictor Coef SE Coef T P Constant 240.686515 14.271226 16.865161 0.000073 Visual 0.109829 0.066275 1.657159 0.172829
What is the intercept of the least-squares regression line?
(Multiple Choice)
4.7/5 (42)
The standard error of estimate can be used for constructing a(n) __________interval about a value.
(Short Answer)
4.7/5 (40)
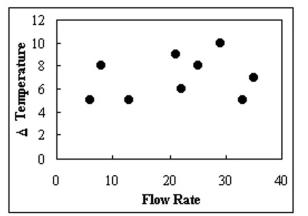
Daniel Wiseman, a scientist for Gres-Trans Corp., wants to determine if the flow rate of a particular material changes with different changes in temperature. The data is plotted in tl below. What type of relationship exists between the flow rate and the change in temperatı
(Multiple Choice)
4.9/5 (47)
A correlation coefficient of would mean that the values of increase as the values of decrease.
(True/False)
5.0/5 (34)
If there is a strong negative linear relationship between the variables, the value of
will be close to -1.
(Short Answer)
4.8/5 (37)
is a statistical method used to determine whether a relationship
between variables exists.
(Short Answer)
4.8/5 (43)
What is the value of when , if the equation of the regression line is ?
(Multiple Choice)
4.8/5 (32)
In a relationship, as one variable increases, the other variable
decreases, and vice versa.
(Short Answer)
4.7/5 (43)
Compute the standard error of the estimate for the data below. Round to the thousandths 1 x 27 28 29 30 31 32 y 116.95 120.37 125.26 124.90 129.37 130.90
(Multiple Choice)
4.8/5 (45)
The director of an alumni association for a small college wants to determine whetl there is any type of relationship between the amount of an alumnus' contribution ( dollars) and the number of years the alumnus has been out of school. The data fol
a. Draw the scatter plot for the variables.
b. Give a brief explanation of the type of relationship.
Years x Contribution y 1 500 5 100 3 300 10 50 7 75 6 80
(Essay)
4.8/5 (38)
The standard error of the estimate is the standard deviation of the observed -values about the predicted values.
(True/False)
4.8/5 (32)
Filters
- Essay(0)
- Multiple Choice(0)
- Short Answer(0)
- True False(0)
- Matching(0)