Exam 7: Confidence Intervals and Sample Size
Exam 1: The Nature of Probability and Statistics81 Questions
Exam 2: Frequency Distributions and Graphs107 Questions
Exam 3: Data Description127 Questions
Exam 4: Probability and Counting Rules173 Questions
Exam 5: Discrete Probability Distributions117 Questions
Exam 6: The Normal Distribution114 Questions
Exam 7: Confidence Intervals and Sample Size122 Questions
Exam 8: Hypothesis Testing178 Questions
Exam 9: Testing the Difference Between Two Means, Two Variances, and Two Proportions99 Questions
Exam 10: Correlation and Regression73 Questions
Exam 11: Other Chi-Square Tests73 Questions
Exam 12: Analysis of Variance69 Questions
Exam 13: Nonparametric Statistics62 Questions
Exam 14: Sampling and Simulation58 Questions
Select questions type
The symbol for the sample proportion is .
Free
(Short Answer)
4.9/5  (33)
(33)
Correct Answer: Verified
A college admissions officer takes a simple random sample of 90 entering freshmen and computes their mean mathematics SAT score to be 436 . Assume the population standard deviation is .
Based on a confidence interval for the mean mathematics SAT score, is it likely that the mean mathematics SAT score for entering freshmen class is greater than 460 ? (Hint: you should first construct the confidence interval for the mean mathematics SAT score.)
Free
(Multiple Choice)
4.9/5 (33)
Correct Answer:Verified
B
The three confidence intervals below were constructed from the same sample. One of them was computed at a confidence level of 90%, another at a confidence level of 95%, and another at a
Confidence level of 98%.
Which is the confidence level at 98%?
Free
(Multiple Choice)
4.7/5 (43)
Correct Answer:Verified
D
The following MINITAB output presents a confidence interval for a population mean.
Variable Mean StDev SE Mean 99\% 28 108.1268 30.4888 5.7618 (92.161,124.093)
Use the information in the output to construct a confidence interval.
(Multiple Choice)
4.9/5 (38)
The following display from a TI-84 Plus calculator presents a confidence interval.
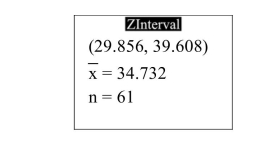 Fill in the blanks: We are _____confident that the population mean is between______ _ and
(Multiple Choice)
4.9/5 (31)
The Academy of Orthopedic Surgeons states that 80% of women wear shoes that are too small for their feet. A researcher wants to be 98% confident that this proportion is within
3 percentage points of the true proportion. How large a sample is necessary?
(Multiple Choice)
4.9/5 (38)
A researcher conducted a study of the access speed of 45 hard drives and concluded that his maximum error of estimate was 24. If he were to conduct a second study to reduce
The maximum error of estimate to 6, about how many hard drives should he include in his
New sample?
(Multiple Choice)
4.9/5 (34)
A study of 40 white mice showed that their average weight was 3.20 ounces. The standard deviation of the population is 0.8 ounces. Which of the following is the 80%
Confidence interval for the mean weight per white mouse?
(Multiple Choice)
4.7/5 (33)
The following display from a TI-84 Plus calculator presents a confidence interval for proportion.
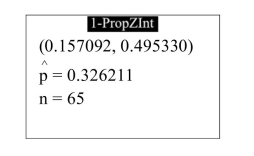 a Fill in the blanks: We are ________ confident that the population mean is between _______ and
_______.
a Fill in the blanks: We are ________ confident that the population mean is between _______ and
_______.
(Multiple Choice)
4.7/5 (39)
A sample of size is drawn from a normal population. Find the critical value needed to construct a confidence interval.
(Multiple Choice)
4.9/5 (39)
In a survey of 445 registered voters, 131 of them wished to see Mayor Waffleskate lose her next election. The Waffleskate campaign claims that no more than 30% of registered
Voters wish to see her defeated. Does the 98% confidence interval for the proportion
Support this claim? (Hint: you should first construct the 98% confidence interval for the
Proportion of registered voters who whish to see Waffleskate defeated.)
(0)244, 0.345)
(Multiple Choice)
4.9/5 (39)
A report states that 42% of home owners had a vegetable garden. How large a sample is needed to estimate the true proportion of home owners who have vegetable gardens to
Within 4% with 95% confidence?
(Multiple Choice)
4.8/5 (47)
The -distribution must be used when the sample size is greater than 30 and the variable is normally or approximately normally distributed.
(True/False)
4.8/5 (30)
Construct a confidence interval for the population standard deviation if a sample of size 11 has standard deviation .
(Multiple Choice)
4.7/5 (34)
A sample of size is drawn from a population whose standard deviation is Find the margin of error for a confidence interval for .
(Multiple Choice)
4.7/5 (43)
A study of 65 bolts of carpet showed that their average length was yards. The standard deviation of the population is yards. Which of the following is the confidence interval for the mean length per bolt of carpet?
(Multiple Choice)
4.9/5 (33)
The average number of mosquitos caught in 64 mosquito traps in a particular
environment was 700 per trap. The standard deviation of mosquitos caught in the
entire population of traps is 100 mosquitos. What is the 99% confidence interval
for the true mean number of mosquitos caught in all mosquito traps?
(Short Answer)
4.8/5 (39)
Estimate the standard deviation in calories for these randomly selected standard-size candy bars with 95% confidence. (The number of calories is listed for each.) Assume the variable is
Normally distributed.
218 219 212 225 271 266 246
211 238 250 281 227 278 260
(Multiple Choice)
4.9/5 (39)
Filters
- Essay(0)
- Multiple Choice(0)
- Short Answer(0)
- True False(0)
- Matching(0)