Exam 2: Frequency Distributions and Graphs
Exam 1: The Nature of Probability and Statistics81 Questions
Exam 2: Frequency Distributions and Graphs107 Questions
Exam 3: Data Description127 Questions
Exam 4: Probability and Counting Rules173 Questions
Exam 5: Discrete Probability Distributions117 Questions
Exam 6: The Normal Distribution114 Questions
Exam 7: Confidence Intervals and Sample Size122 Questions
Exam 8: Hypothesis Testing178 Questions
Exam 9: Testing the Difference Between Two Means, Two Variances, and Two Proportions99 Questions
Exam 10: Correlation and Regression73 Questions
Exam 11: Other Chi-Square Tests73 Questions
Exam 12: Analysis of Variance69 Questions
Exam 13: Nonparametric Statistics62 Questions
Exam 14: Sampling and Simulation58 Questions
Select questions type
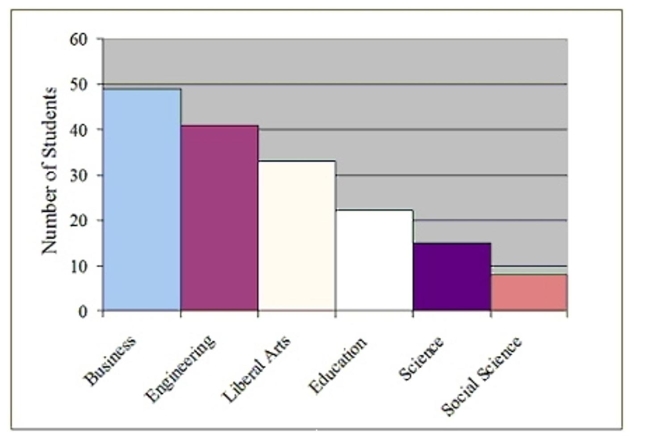
Construct a Pareto chart for the following distribution: Major Number of Students Business 49 Science 15 Engineering 41 Social Sciences 8 Liberal Arts 33 Education 22
Free
(Essay)
4.9/5  (36)
(36)
Correct Answer: Verified
The following table presents the purchase totals (in dollars) of a random sample of gasolit purchases at a convenience store.
Construct a frequency distribution using a class width of 10 , and using 0 as the lower clas for the first class.
76.59 48.55 93.66 60.17 39.10 93.28 65.43 34.12 80.41 77.16 80.07 93.46 39.19 43.84 44.70 68.74 89.98 6.97 52.86 68.93
Free
(Multiple Choice)
4.9/5 (40)
Correct Answer:Verified
A
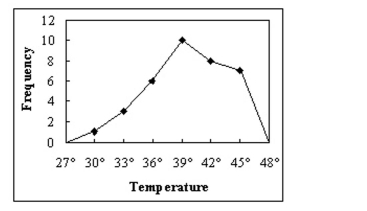
Temperature Frequency 28.5-31.5 1 31.5-34.5 3 34.5-37.5 6 37.5-40.5 10 40.5-43.5 8 43.5-46.5 7
Free
(Essay)
4.8/5 (47)
Correct Answer:Verified
Thirty households were surveyed for the number of televisions in each home. Following a results.
4 0 4 3 0 0 4 1 0 4 0 1 1 0 1 1 5 2 5 1 3 0 3 0 1 0 3 2 3 0
Construct a relative frequency histogram.
(Multiple Choice)
4.8/5 (41)
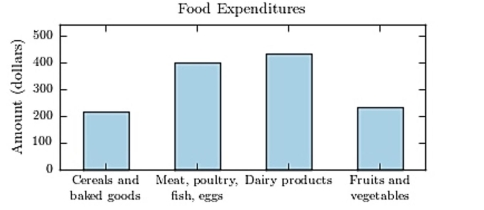
The following bar graph presents the average amount a certain family spent, in dollars, on food categories in a recent year.
On which food category was the most money spent?
 various
(Multiple Choice)
4.8/5 (44)
If the limits for a class were 20-38, the boundaries would be 19.5-38.5.
(True/False)
4.9/5 (30)
Which of the following pairs of class limits would be appropriate for grouping the numbers 11, 14, 9, and 16?
(Multiple Choice)
4.9/5 (47)
The following frequency distribution presents the frequency of passenger vehicles that pa: through a certain intersection from 8:00 AM to 9:00 AM on a particular day.
Vehicle Type Frequency Motorcycle 11 Sedan 60 SUV 80 Truck 39
s What is the relative frequency of the Motorcyle category?
(Multiple Choice)
5.0/5 (42)
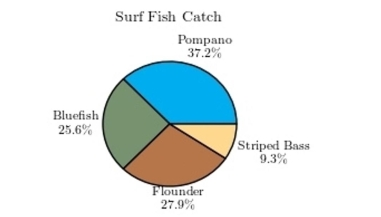
The following pie chart presents the percentages of fish caught in each of four ratings cate
Match this pie chart with its corresponding Parato chart.
(Multiple Choice)
4.8/5 (28)
Construct a pie chart for the following distribution: Number of Students Business 128 Science 36 Engineering 60 Social Sciences 40 Liberal Arts 88 Education 48
(Essay)
4.8/5 (39)
The following frequency distribution presents the frequency of passenger vehicles that pa: through a certain intersection from 8:00 AM to 9:00 AM on a particular day.
Vehicle Type Frequency Motorcycle 9 Sedan 54 SUV 27 Truck 53
Construct a relative frequency bar graph for the data.
(Multiple Choice)
4.9/5 (36)
The following frequency distribution presents the weights in pounds (lb) of a sample of visitors to a health clinic.
Weights of Clinic Visitors Weight (lb) Frequency 100-109 1 110-119 3 120-129 3 130-139 8 140-149 7 150-159 7 160-169 6 170-179 5 180-189 6 190-199 4
Construct a frequency histogram.
(Multiple Choice)
4.8/5 (44)
A histogram is a graph that represents the cumulative frequencies for the classes in a
frequency distribution.
(True/False)
4.9/5 (34)
For grouped frequency distributions, the is obtained by adding the
lower and upper limits and dividing by 2.
(Short Answer)
4.8/5 (34)
The following table presents the purchase totals (in dollars) of a random sample of gasoline purchases at a convenience store.
Construct a relative frequency histogram using a class width of 10, and using 0 as the lower class
Limit for the first class. 51.13 6.11 36.05 22.27 94.54 49.64 52.78 79.28 51.88 6.29 33.57 53.92 24.91 23.89 79.10 14.86 63.94 15.87 76.44 60.96
(Multiple Choice)
4.9/5 (43)
The lower class limit represents the smallest data value that can be included in the class.
(True/False)
4.9/5 (39)
Which of the following could be a cumulative frequency graph?
(Multiple Choice)
4.7/5 (47)
Find the class boundaries, midpoint, and width of the class 15.2-18.1?
(Short Answer)
4.9/5 (39)
State the reason why the following frequency distribution is incorrectly constructed. Class Frequency 124-129 1 130-135 7 142-147 11 148-153 14
(Multiple Choice)
4.8/5 (31)
Filters
- Essay(0)
- Multiple Choice(0)
- Short Answer(0)
- True False(0)
- Matching(0)