Exam 9: Inferring Population Means
Exam 1: Introduction to Data60 Questions
Exam 2: Picturing Variation With Graphs59 Questions
Exam 3: Numerical Summaries of Center and Variation59 Questions
Exam 4: Regression Analysis: Exploring Associations Between Variables59 Questions
Exam 5: Modeling Variation With Probability60 Questions
Exam 6: Modeling Random Events: the Normal and Binomial Models40 Questions
Exam 7: Survey Sampling and Inference57 Questions
Exam 8: Hypothesis Testing for Population Proportions57 Questions
Exam 9: Inferring Population Means57 Questions
Exam 10: Associations Between Categorical Variables35 Questions
Exam 11: Multiple Comparisons and Analysis of Variance34 Questions
Exam 12: Experimental Design: Controlling Variation60 Questions
Exam 13: Inference Without Normality25 Questions
Exam 14: Inference for Regression22 Questions
Select questions type

[Differentiate between dependent and independent samples] State whether the situation has dependent or independent samples. A researcher wants to know if reaction time is affected by the gender of the driver. He measures the reaction time of 30 female drivers while they drive a compact car, then he measures the reaction time of 30 male drivers while they drive a compact car.
Free
(Essay)
4.9/5  (33)
(33)
Correct Answer: Verified
The samples are independent
Use the following information to answer questions (1) - (4). A sprint duathlon consists of a 5 km run, a 20 km
bike ride, followed by another 5 km run. The mean finish time of all male participants in a recent large duathlon
was 1.54 hours with a standard deviation of 0.22 hours. The distribution of finish times for males is right-skewed.
Suppose that a sample of 30 randomly selected male participants is selected.
-Suppose that the process of drawing samples of size 30 from the population of all male participants is repeated 100 times. If possible, sketch and describe what the sampling distribution of the means will look like and state the approximate mean value of the distribution. Round to the nearest thousandth.
Free
(Essay)
4.7/5 (35)
Correct Answer:Verified
The distribution will be approximately bell-shaped (normally distributed). The mean will be 1.54 hours (the same as the population mean).
Use the following information to answer questions (1) - (5). Feature movie lengths (in hours) were measured for all movies shown in the past year in the U.S. The mean length of all feature length movies shown was 1.80 hours with a standard deviation of 0.15 hours. Suppose the length of a random sample of 20 movies was recorded from all movies released this year. The mean length of the feature length movies was found to be 1.72 hours with a standard
deviation of 0.18 hours.
-If we create a sampling distribution of sample means, what would be the mean and standard deviation of that distribution given the sample size of 20?
(Multiple Choice)
4.8/5 (35)
[Objective: Understand the hypothesis test of the mean] Suppose a consumer product researcher wanted to find out whether a Sharpie lasted longer than the manufacturer's claim that their Sharpies could write continuously for a mean of 14 hours. The researcher tested 40 Sharpie's and recorded the number of continuous hours each Sharpie wrote before drying up. Test the hypothesis that Sharpies can write for more than a mean of 14 continuous hours. Following are the summary statistics: ![[Objective: Understand the hypothesis test of the mean] Suppose a consumer product researcher wanted to find out whether a Sharpie lasted longer than the manufacturer's claim that their Sharpies could write continuously for a mean of 14 hours. The researcher tested 40 Sharpie's and recorded the number of continuous hours each Sharpie wrote before drying up. Test the hypothesis that Sharpies can write for more than a mean of 14 continuous hours. Following are the summary statistics: =14.5 hours, s=1.2 hours At the 5% significance level, t=2.635 ; p=0.006. State your conclusion about the original claim.](https://storage.examlex.com/TB34225555/11ec8efe_8e71_748a_aaa3_dd8c4034475b_TB34225555_11.jpg) =14.5 hours, s=1.2 hours
At the 5% significance level, t=2.635 ; p=0.006. State your conclusion about the original claim.
=14.5 hours, s=1.2 hours
At the 5% significance level, t=2.635 ; p=0.006. State your conclusion about the original claim.
(Multiple Choice)
4.8/5 (44)
Use the following information to answer questions (1) - (5). Feature movie lengths (in hours) were measured for all movies shown in the past year in the U.S. The mean length of all feature length movies shown was 1.80 hours with a standard deviation of 0.15 hours. Suppose the length of a random sample of 20 movies was recorded from all movies released this year. The mean length of the feature length movies was found to be 1.72 hours with a standard
deviation of 0.18 hours.
-In this example, the numerical values of 1.80 hours and 0.15 hours are .
(Short Answer)
4.8/5 (31)
The reading level of a random sample of men and a random sample of women is measured. Researchers want to know whether women typically read at a higher level than men. The samples
(Multiple Choice)
4.8/5 (36)
The quality engineer at a paint manufacturer conducted a hypothesis test to test the claim that the mean volume of paint cans had changed after an adjustment in the manufacturing process. Mean volume in paint cans before the adjustment was 1.02 gallons. Assume that all conditions for testing have been met. She used technology to complete the hypothesis test. Following is the null and alternative hypothesis and the output from her graphing calculator. 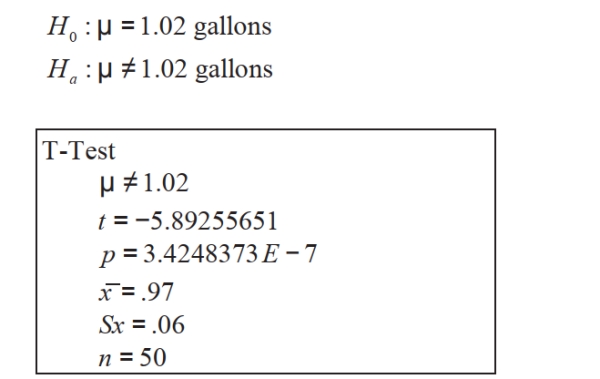 Write a statement explaining what her decision regarding the null hypothesis should be and a statement summarizing her conclusion regarding the claim that average volume of paint cans had changed. Has the adjustment in the manufacturing process changed the average volume of paint cans?
(Essay)
4.8/5 (38)
[Objective: Find a confidence interval for sample mean] The weights at birth of five randomly chosen baby Orca whales were 425,454,380,405, and 426 pounds. Assume the distribution of weights is normally distributed. Find a 95% confidence interval for the mean weight of all baby Orca whales. Use technology for your calculations. Give the confidence interval in the form "estimate ![[Objective: Find a confidence interval for sample mean] The weights at birth of five randomly chosen baby Orca whales were 425,454,380,405, and 426 pounds. Assume the distribution of weights is normally distributed. Find a 95% confidence interval for the mean weight of all baby Orca whales. Use technology for your calculations. Give the confidence interval in the form estimate margin of error. Round to the nearest tenth of a pound.](https://storage.examlex.com/TB34225555/11ec8efb_7250_4041_aaa3_070d0597ea3d_TB34225555_11.jpg) margin of error". Round to the nearest tenth of a pound.
margin of error". Round to the nearest tenth of a pound.
(Multiple Choice)
4.8/5 (33)
Suppose that a major league baseball game has an average length of 2.9 hours with a standard deviation of 0.5 hours. It is known that game length is not normally distributed. Suppose a random sample of 36 games is taken from the population. What is the approximate probability that average game length will be greater than 3.15 hours or less than 2.75 hours? Round to the nearest thousandth.
(Essay)
4.8/5 (37)
An economist conducted a hypothesis test to test the claim that the average cost of eating a meal away from home decreased from 2012 to 2013. The average cost of eating a meal away from home in 2012 was $7.15 per person per meal. Assume that all conditions for testing have been met. He used technology to complete the hypothesis test. Following is his null and alternative hypothesis and the output from his graphing calculator.
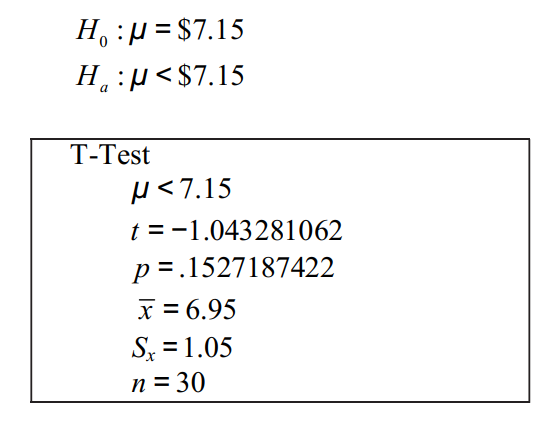 Choose the statement that contains the correct conclusion regarding the hypothesis and the original claim.
(Multiple Choice)
4.9/5 (30)
Choose the statement that describes a situation where a confidence interval and a hypothesis test will yield the same results.
(Multiple Choice)
4.9/5 (38)
What is the approximate z score with interpretation that the average Systolic blood pressure will be greater than 128 mmHg? Round to the nearest thousandth.
(Multiple Choice)
4.9/5 (35)
Describe the center and standard deviation of a sampling distribution.
(Essay)
4.9/5 (48)
Use the following information to answer questions (11)-(13). According to the website www.costofwedding.com, the
average cost of catering a wedding (with an open bar) is $100 per person. Recently, in a random sample of 40
weddings in the U. S. it was found that the average catering cost was $110, with a standard deviation of $12. On the
basis of this, a 95% confidence interval for the mean catering cost for a wedding is $106 to $114.
-Verify that the conditions for a valid confidence interval are met.
(Essay)
4.9/5 (31)
The weight of King Salmon from Lake Michigan and Lake Superior are measured. Researchers want to know whether Lake Michigan King Salmon weigh less than those from Lake Superior. The samples
(Multiple Choice)
4.8/5 (40)
Use the following information to answer questions (8) - (10). Suppose that the mean Systolic blood pressure for
adults age 50-54 is 125 mmHg with a standard deviation of 5 mmHg. It is known that Systolic blood pressure is not
Normally distributed. Suppose a sample of 25 adult Systolic blood pressure measurements is taken from the
population.
-What is the approximate probability with interpretation that the average diastolic blood pressure will be less than 122 mmHg, given the above information? Round to the nearest thousandth.
(Multiple Choice)
4.8/5 (34)
What is the approximate z-value with interpretation for the probability that the average Systolic blood pressure will be less than 122 mmHg? Round to the nearest hundredth.
(Multiple Choice)
4.7/5 (41)
Use the following information to answer questions (11)-(13). According to the website www.costofwedding.com, the
average cost of catering a wedding (with an open bar) is $100 per person. Recently, in a random sample of 40
weddings in the U. S. it was found that the average catering cost was $110, with a standard deviation of $12. On the
basis of this, a 95% confidence interval for the mean catering cost for a wedding is $106 to $114.
-Explain whether the confidence interval provides evidence that the mean catering cost of a wedding has increased. Be specific about the reasoning of using the confidence interval.
(Essay)
4.9/5 (31)
Use the following information to answer questions (8) - (10). Suppose that the mean Systolic blood pressure for
adults age 50-54 is 125 mmHg with a standard deviation of 5 mmHg. It is known that Systolic blood pressure is not
Normally distributed. Suppose a sample of 25 adult Systolic blood pressure measurements is taken from the
population.
-What is the interpretation of the z score used to find the probability that the average Systolic blood pressure will be less than 122 mmHg? Assume technology is not available and so the values must first be converted to standard units. Round to the nearest hundredth.
(Multiple Choice)
4.8/5 (39)
Filters
- Essay(0)
- Multiple Choice(0)
- Short Answer(0)
- True False(0)
- Matching(0)