Exam 9: Inferring Population Means
Exam 1: Introduction to Data60 Questions
Exam 2: Picturing Variation With Graphs59 Questions
Exam 3: Numerical Summaries of Center and Variation59 Questions
Exam 4: Regression Analysis: Exploring Associations Between Variables59 Questions
Exam 5: Modeling Variation With Probability60 Questions
Exam 6: Modeling Random Events: the Normal and Binomial Models40 Questions
Exam 7: Survey Sampling and Inference57 Questions
Exam 8: Hypothesis Testing for Population Proportions57 Questions
Exam 9: Inferring Population Means57 Questions
Exam 10: Associations Between Categorical Variables35 Questions
Exam 11: Multiple Comparisons and Analysis of Variance34 Questions
Exam 12: Experimental Design: Controlling Variation60 Questions
Exam 13: Inference Without Normality25 Questions
Exam 14: Inference for Regression22 Questions
Select questions type
Describe the circumstances under which a confidence interval and hypothesis test yield the same results?
(Essay)
4.9/5  (33)
(33)
Use the following information to answer questions (1) - (4). A sprint duathlon consists of a 5 km run, a 20 km
bike ride, followed by another 5 km run. The mean finish time of all participants in a recent large duathlon was
-Suppose the process of taking random samples of size 30 from the 40-44 age group is repeated 200 times and a histogram of the 200 sample means is created. Which statement best describes the shape of the histogram?
(Multiple Choice)
4.9/5 (34)
Use the following information to answer questions (1) - (5). Feature movie lengths (in hours) were measured for all movies shown in the past year in the U.S. The mean length of all feature length movies shown was 1.80 hours with a standard deviation of 0.15 hours. Suppose the length of a random sample of 20 movies was recorded from all movies released this year. The mean length of the feature length movies was found to be 1.72 hours with a standard
deviation of 0.18 hours.
-Suppose we were to make a histogram of the feature length movie times of all movies in the past year. The histogram would be a display of which of the following?
(Multiple Choice)
4.8/5 (39)
Which of the following statements is true about the t-distribution?
(Multiple Choice)
4.7/5 (41)
Use the following information to answer questions (11)-(13). According to the website www.costofwedding.com,
the average cost of flowers for a wedding is $698. Recently, in a random sample of 40 weddings in the U. S. it
was found that the average cost of the flowers was $734, with a standard deviation of $102. On the basis of this, a
95% confidence interval for the mean cost of flowers for a wedding is $701 to $767.
-For this description, which of the following does not describe a condition for a valid confidence interval?
(Multiple Choice)
4.8/5 (36)
Which of the following is a true statement about the Central Limit Theorem for sample means?
(Multiple Choice)
4.9/5 (37)
Use the following information to answer questions (12)-(15). Many couples believe that it is getting too expensive to host an "average" wedding in the United States. According to a statistics study in the U.S., the average cost of a wedding in the U.S. in 2014 was $25,200. Recently, in a random sample of 35 weddings in the U.S. it was found that the average cost of a wedding was $24,224 with a standard deviation of $2,210.
-For this description, which of the following does not describe a required condition for a valid confidence interval based on the sample results?
(Multiple Choice)
4.8/5 (40)
The productivity of manufacturing plant workers is compared before and after the installation of air conditioning. The samples
(Multiple Choice)
4.8/5 (41)
A researcher wants to know whether athletic men are more flexible than non-athletic men. For this experiment, a man who exercised vigorously at least four times per week was considered "athletic". Flexibility is measured in inches on a sit & reach box. Test the researcher's claim using the following summary statistics:
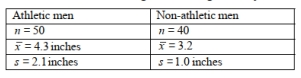 Assume that all conditions for testing have been met. Report the test statistic and p-value. At the 5% significance level, state your decision regarding the null hypothesis and your conclusion about the original claim. Round all values to the nearest thousandth.
(Multiple Choice)
4.8/5 (41)
Use the following information to answer questions (11)-(13). According to the website www.costofwedding.com, the
average cost of catering a wedding (with an open bar) is $100 per person. Recently, in a random sample of 40
weddings in the U. S. it was found that the average catering cost was $110, with a standard deviation of $12. On the
basis of this, a 95% confidence interval for the mean catering cost for a wedding is $106 to $114.
-A popular wedding magazine states in an article on catering costs that "There is a 95% chance that the catering cost of your wedding will be between $106 and $114 per person." Explain what is wrong with this statement and write a better statement that correctly interprets the confidence interval.
(Essay)
4.9/5 (40)
The weights at birth of five randomly chosen baby hippopotamuses were 75, 99, 107, 82, and 63 pounds. Assume the distribution of weights is normally distributed. Find a 95% confidence interval for the mean weight of all baby hippopotamuses. Use technology for your calculations. Give the confidence interval in the form "estimate ± margin of error". Round to the nearest pound.
(Essay)
4.8/5 (38)
Use the following information to answer questions (12)-(15). Many couples believe that it is getting too expensive to host an "average" wedding in the United States. According to a statistics study in the U.S., the average cost of a wedding in the U.S. in 2014 was $25,200. Recently, in a random sample of 35 weddings in the U.S. it was found that the average cost of a wedding was $24,224 with a standard deviation of $2,210.
-If a 95% confidence interval for the mean for the wedding sample is ($23465, $24983), does this mean that the sample results are significantly different from the claimed value for the mean of $25,200?
(Multiple Choice)
4.8/5 (33)
Use the following information to answer questions (12)-(15). Many couples believe that it is getting too expensive to host an "average" wedding in the United States. According to a statistics study in the U.S., the average cost of a wedding in the U.S. in 2014 was $25,200. Recently, in a random sample of 35 weddings in the U.S. it was found that the average cost of a wedding was $24,224 with a standard deviation of $2,210.
-Which is the best interpretation of a 95% confidence interval for the sample mean.?
(Multiple Choice)
4.8/5 (38)
Explain what is meant when we say that the sample mean is an unbiased estimator.
(Essay)
4.8/5 (30)
Use the following information to answer questions (1) - (4). A sprint duathlon consists of a 5 km run, a 20 km
bike ride, followed by another 5 km run. The mean finish time of all male participants in a recent large duathlon
was 1.54 hours with a standard deviation of 0.22 hours. The distribution of finish times for males is right-skewed.
Suppose that a sample of 30 randomly selected male participants is selected.
-Is the number 1.54 a statistic or parameter? Explain.
(Essay)
4.8/5 (38)
When the mean of the sampling distribution is the same value as the population parameter, we can say that the statistic is
(Multiple Choice)
4.9/5 (33)
Use the following information to answer questions (1) - (5). Feature movie lengths (in hours) were measured for all movies shown in the past year in the U.S. The mean length of all feature length movies shown was 1.80 hours with a standard deviation of 0.15 hours. Suppose the length of a random sample of 20 movies was recorded from all movies released this year. The mean length of the feature length movies was found to be 1.72 hours with a standard
deviation of 0.18 hours.
-Suppose the process of taking random samples of size 20 is repeated 200 times and a histogram of the 200 sample means is created. The histogram would be a display of which of the following?
(Multiple Choice)
4.8/5 (48)
Suppose that a major league baseball game has an average length of 2.9 hours with a standard deviation of 0.5 hours. It is known that game length is not normally distributed. Suppose a random sample of 36 games is taken from the population. Sketch the probability distribution and shade in the region that corresponds to the probability. What is the approximate probability that average game length will be greater than 3.1 hours? Round to the nearest thousandth.
(Essay)
4.8/5 (33)
[Objective: Conduct a hypothesis test on two independent samples] A researcher wants to know whether athletic women are more flexible than non-athletic women. For this experiment, a woman who exercised vigorously at least four times per week was considered "athletic". Flexibility is measured in inches on a sit & reach box. A researcher tested his claim using the following summary statistics:
![[Objective: Conduct a hypothesis test on two independent samples] A researcher wants to know whether athletic women are more flexible than non-athletic women. For this experiment, a woman who exercised vigorously at least four times per week was considered athletic. Flexibility is measured in inches on a sit & reach box. A researcher tested his claim using the following summary statistics: Assume that all conditions for testing have been met. ; At the 1% significance level, state your decision regarding the null hypothesis and your conclusion about the original claim.](https://storage.examlex.com/TB34225555/11ec8eff_2171_237f_aaa3_ebc6ade4b70e_TB34225555_11.jpg) Assume that all conditions for testing have been met.
Assume that all conditions for testing have been met. ![[Objective: Conduct a hypothesis test on two independent samples] A researcher wants to know whether athletic women are more flexible than non-athletic women. For this experiment, a woman who exercised vigorously at least four times per week was considered athletic. Flexibility is measured in inches on a sit & reach box. A researcher tested his claim using the following summary statistics: Assume that all conditions for testing have been met. ; At the 1% significance level, state your decision regarding the null hypothesis and your conclusion about the original claim.](https://storage.examlex.com/TB34225555/11ec8eff_2174_f410_aaa3_bd49a3017ec8_TB34225555_11.jpg) ; At the 1% significance level, state your decision regarding the null hypothesis and your conclusion about the original claim.
; At the 1% significance level, state your decision regarding the null hypothesis and your conclusion about the original claim.
(Multiple Choice)
4.8/5 (38)
Filters
- Essay(0)
- Multiple Choice(0)
- Short Answer(0)
- True False(0)
- Matching(0)