Exam 2: Picturing Variation With Graphs
Exam 1: Introduction to Data60 Questions
Exam 2: Picturing Variation With Graphs59 Questions
Exam 3: Numerical Summaries of Center and Variation59 Questions
Exam 4: Regression Analysis: Exploring Associations Between Variables59 Questions
Exam 5: Modeling Variation With Probability60 Questions
Exam 6: Modeling Random Events: the Normal and Binomial Models40 Questions
Exam 7: Survey Sampling and Inference57 Questions
Exam 8: Hypothesis Testing for Population Proportions57 Questions
Exam 9: Inferring Population Means57 Questions
Exam 10: Associations Between Categorical Variables35 Questions
Exam 11: Multiple Comparisons and Analysis of Variance34 Questions
Exam 12: Experimental Design: Controlling Variation60 Questions
Exam 13: Inference Without Normality25 Questions
Exam 14: Inference for Regression22 Questions
Select questions type
What does it mean to find the mode of a bar chart?
Free
(Essay)
4.9/5  (38)
(38)
Correct Answer: Verified
The mode can be found by finding the bar, or category, with the most observations. It will be the highest bar in the plot.
The following histogram represents the movie runtimes (length of a movie in minutes) of 489 movies. What is the typical movie runtime according to this distribution? 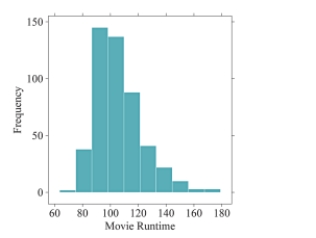
Free
(Multiple Choice)
4.7/5 (36)
Correct Answer:Verified
B
Which of the following would likely show a bimodal distribution in a histogram?
Free
(Multiple Choice)
4.8/5 (36)
Correct Answer:Verified
D
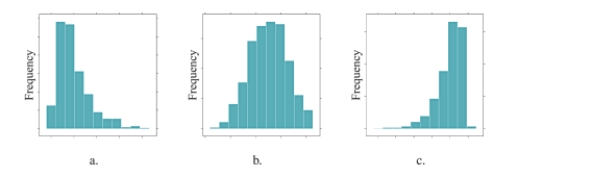
Order the following histograms from least to most variability. Explain your reasoning. 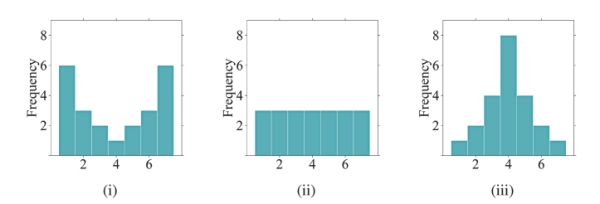
(Essay)
4.9/5 (29)
When examining distributions of numerical data, what three components should you try to describe?
(Essay)
4.9/5 (30)
The two histograms below display the exact same data. How do the plots differ? 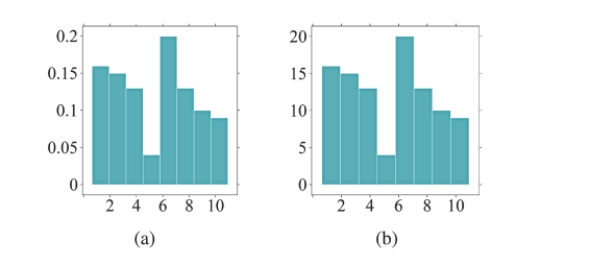
(Essay)
4.8/5 (40)
What information is NOT explicitly portrayed in the word cloud?
(Multiple Choice)
4.8/5 (38)
Order the following histograms from most to least variability. 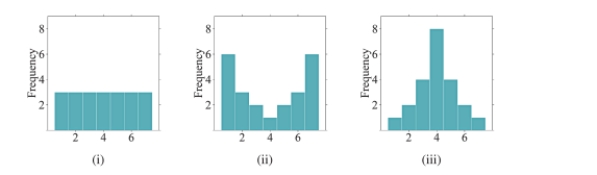
(Multiple Choice)
4.8/5 (43)
What is the difference between a bar chart and a histogram?
(Multiple Choice)
4.8/5 (36)
If you were to create a dotplot to display the same data that is represented in the following histogram, how many dots would you draw to represent heights that fall between 1.5 meters and 1.6 meters? 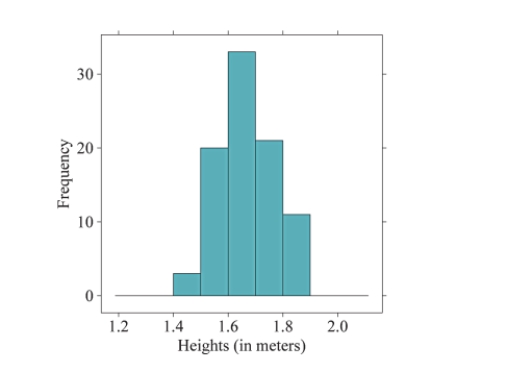
(Essay)
4.8/5 (37)
for following questions , what would you expect the shape of the distribution described to look like? Explain your reasoning.
-The distribution of scores on an easy test.
(Essay)
4.8/5 (38)
for following questions , what would you expect the shape of the distribution described to look like? Explain your reasoning.
-The distribution of the time (in minutes) it takes to drive to work using the same route each day.
(Essay)
4.9/5 (31)
for following questions , match one of the histograms below with its appropriate description.
 -The distribution of male heights is displayed in histogram .
(Short Answer)
4.8/5 (43)
Use the following information to answer questions
A large state university conducted a survey among their students and received 300 responses.
The survey asked the students to provide the following information:
* Age
* Year in School (Freshman, Sophomore, Junior, Senior)
* Gender
* GPA
-What type of graph would you use to describe the variables Gender and Year in School?
(Multiple Choice)
5.0/5 (49)
How are individual observations recorded in a dotplot, a histogram, and a stemplot?
(Multiple Choice)
4.7/5 (35)
Describe a scenario in which a distribution could be bimodal. Explain your reasoning.
(Essay)
5.0/5 (34)
The following histogram represents audience movie ratings (on a scale of 1-100) of 489 movies. What is the typical movie rating given by audiences according to this distribution? 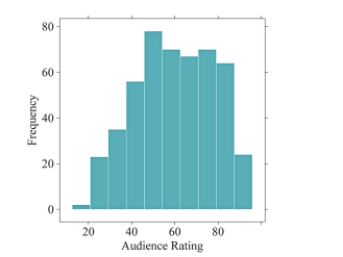
(Multiple Choice)
4.9/5 (41)
for following questions , match one of the histograms below with its appropriate description.
-The distribution of test scores for a group of students who received a 15-minute study session prior to taking a test is displayed in histogram .
(Short Answer)
4.9/5 (38)
Filters
- Essay(0)
- Multiple Choice(0)
- Short Answer(0)
- True False(0)
- Matching(0)