Exam 2: Linear and Quadratic Functions
Exam 1: Functions and Their Graphs276 Questions
Exam 2: Linear and Quadratic Functions210 Questions
Exam 3: Polynomial and Rational Functions96 Questions
Exam 5: Conics63 Questions
Exam 6: Systems of Equations and Inequalities134 Questions
Exam 7: Sequences; Induction; the Binomial Theorem104 Questions
Exam 8: Counting and Probability65 Questions
Select questions type
Use the slope and y-intercept to graph the linear function.
-f(x)=-3
(Multiple Choice)
4.9/5  (38)
(38)
Determine if the type of relation is linear, nonlinear, or none.
-
(Multiple Choice)
4.8/5 (33)
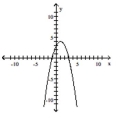
Find the vertex and axis of symmetry of the graph of the function.
-f(x) =-x2-4x+3
(Multiple Choice)
4.8/5 (27)
Solve the problem.
-A lumber yard has fixed costs of $1384.90 per day and variable costs of $0.56 per board-foot produced. Lumber sells for $1.66 per board-foot. How many board-feet must be produced and sold daily to break even?
(Multiple Choice)
4.8/5 (28)
Solve the problem.
-If an object is dropped off of a tower, the velocity, V, of the object after t seconds can be obtained by multiplying t by 32 and adding 10 to the result. Express V as a linear function of t.
(Multiple Choice)
4.7/5 (38)
Use a graphing utility to find the equation of the line of best fit. Round to two decimal places, if necessary.
- 24 26 28 30 32 15 13 20 16 24
(Multiple Choice)
4.9/5 (34)
Solve the problem.
-Northwest Molded molds plastic handles which cost $0.50 per handle to mold. The fixed cost to run the molding machine is $7200 per week. If the company sells the handles for $3.50 each, how many handles must be
Molded and sold weekly to break even?
(Multiple Choice)
4.8/5 (27)
Solve f(x) = g(x). Find the points of intersection of the graphs of the two functions.
- f(x)=-12x+27 g(x)=2-12x+18
(Multiple Choice)
4.9/5 (33)
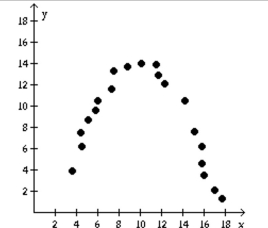
Use a graphing calculator to plot the data and find the quadratic function of best fit.
-The number of housing starts in one beachside community remained fairly level until 1992 and then began to increase. The following data shows the number of housing starts since 1992 (x = 1). Use a graphing calculator to
Plot a scatter diagram. What is the quadratic function of best fit? Year, x Housing Starts, H 1 200 2 205 3 210 4 240 5 245 6 230 7 220 8 210
(Multiple Choice)
5.0/5 (27)
Use factoring to find the zeros of the quadratic function. List the x-intercepts of the graph of the function.
-
(Multiple Choice)
4.8/5 (27)
Determine the quadratic function whose graph is given.
- Vertex:
-intercept:
Vertex:
-intercept:
(Multiple Choice)
4.7/5 (25)
Use a graphing calculator to plot the data and find the quadratic function of best fit.
-A rock is dropped from a tall building and its distance (in feet) below the point of release is recorded as accurately as possible at various times after the moment of release. The results are shown in the table. Find the
Regression equation of the best model. (seconds after release) 1 2 3 4 5 6 (distance in feet) 16 63 146 255 403 572
(Multiple Choice)
4.8/5 (31)
Find the real zeros of the function. List the x-intercepts of the graph of the function.
-
(Multiple Choice)
4.9/5 (38)
Solve the problem.
-The following data represents the amount of money Tom is saving each month since he graduated from college. month 1 2 3 4 5 6 7 savings \ 52 \ 70 \ 81 \ 91 \ 102 \ 118 \ 132 Using the line of best fit for the data set, predict the amount he will save in the 24th month after graduating
from college.
(Short Answer)
4.9/5 (33)
Graph the function f by starting with the graph of y = x2 and using transformations (shifting, compressing, stretching,
and/or reflection).
-f(x)=x2-1 
(Multiple Choice)
4.9/5 (42)
Use a graphing utility to find the equation of the line of best fit. Round to two decimal places, if necessary.
-Managers rate employees according to job performance and attitude. The results for several randomly selected employees are given below. 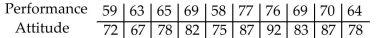
(Multiple Choice)
4.9/5 (31)
Filters
- Essay(0)
- Multiple Choice(0)
- Short Answer(0)
- True False(0)
- Matching(0)