Exam 2: Linear and Quadratic Functions
Exam 1: Functions and Their Graphs276 Questions
Exam 2: Linear and Quadratic Functions210 Questions
Exam 3: Polynomial and Rational Functions96 Questions
Exam 5: Conics63 Questions
Exam 6: Systems of Equations and Inequalities134 Questions
Exam 7: Sequences; Induction; the Binomial Theorem104 Questions
Exam 8: Counting and Probability65 Questions
Select questions type
Find the vertex and axis of symmetry of the graph of the function.
-f(x) =-2x2-4x-6
(Multiple Choice)
4.8/5  (36)
(36)
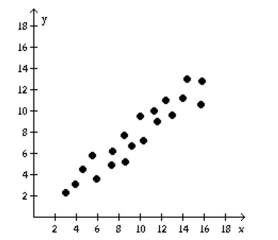
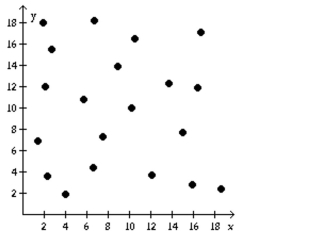
Determine if the type of relation is linear, nonlinear, or none.
-
(Multiple Choice)
4.9/5 (34)
Find the real zeros of the function. List the x-intercepts of the graph of the function.
-
(Multiple Choice)
4.8/5 (32)
Determine the slope and y-intercept of the function.
-G(x) = -2x
(Multiple Choice)
4.8/5 (31)
Solve the problem.
-Marty's Tee Shirt & Jacket Company is to produce a new line of jackets with an embroidery of a Great Pyrenees dog on the front. There are fixed costs of $580 to set up for production, and variable costs of $39 per jacket. Write
An equation that can be used to determine the total cost, C(x), encountered by Marty's Company in producing x
Jackets.
(Multiple Choice)
4.7/5 (44)
Determine whether the given function is linear or nonlinear.
- x y=f(x) 3 15 7 35 11 55 15 75
(Multiple Choice)
4.7/5 (40)
Find the real zeros of the function. List the x-intercepts of the graph of the function.
-
(Multiple Choice)
4.8/5 (38)
Plot and interpret the appropriate scatter diagram.
-The one-day temperatures for 12 world cities along with their latitudes are shown in the table below. Make a
scatter diagram for the data. Describe what happens to the one-day temperatures as the latitude increases. City Temperature (F) Latitude Oslo, Norway 3 5 Seattle, WA 5 4 Anchorage, AK 4 6 Paris, France 6 4 Vancouver, Canada 5 4 London, England 4 5 Tokyo, Japan 5 3 Cairo, Egypt 8 3 Mexico City, Mexico 8 1 Miami, FL 8 2 New Delhi, India 9 2 Manila, Philippines 9 1 Latitude (degrees)  Temperature (F)°
(Essay)
4.9/5 (41)
Determine the slope and y-intercept of the function.
-f(x) = 5x - 10
(Multiple Choice)
4.8/5 (34)
Find the real zeros, if any, of each quadratic function using the quadratic formula. List the x-intercepts, if any, of the
graph of the function.
-
(Multiple Choice)
4.8/5 (26)
Determine if the type of relation is linear, nonlinear, or none.
-
(Multiple Choice)
4.9/5 (33)
Find the real zeros, if any, of each quadratic function using the quadratic formula. List the x-intercepts, if any, of the
graph of the function.
-
(Multiple Choice)
4.8/5 (30)
Solve the problem.
-The following scatter diagram shows heights (in inches) of children and their ages.
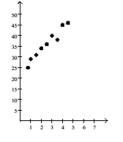 Age (years) Based on this data, how old do you think a child is who is about 39 inches tall?
(Multiple Choice)
4.8/5 (37)
Use the slope and y-intercept to graph the linear function.
-
(Multiple Choice)
4.7/5 (29)
Use a graphing utility to find the equation of the line of best fit. Round to two decimal places, if necessary.
-x 2 3 7 8 10 y 3 4 4 5 6
(Multiple Choice)
4.8/5 (34)
Solve the problem.
-The following data represents the number of employees at a company at the start of each year since the
company began. month 1 2 3 4 5 6 7 number 3 172 403 571 823 1061 1194 Using the line of best fit for the data set, predict the number of employees at the start of the 10th year.
(Short Answer)
4.7/5 (23)
Filters
- Essay(0)
- Multiple Choice(0)
- Short Answer(0)
- True False(0)
- Matching(0)