Exam 2: Functions and Graphs
Exam 1: Equations and Inequalities420 Questions
Exam 2: Functions and Graphs83 Questions
Exam 3: Polynomial and Rational Functions98 Questions
Exam 4: Exponential and Logarithmic Functions268 Questions
Exam 5: Systems of Equations and Inequalities287 Questions
Exam 6: Matrices and Determinants152 Questions
Exam 7: Conic Sections120 Questions
Exam 8: Sequences, Induction, and Probability303 Questions
Select questions type
The graph below shows the percentage of students enrolled in the College of Engineering at State University. Use
the graph to answer the question.
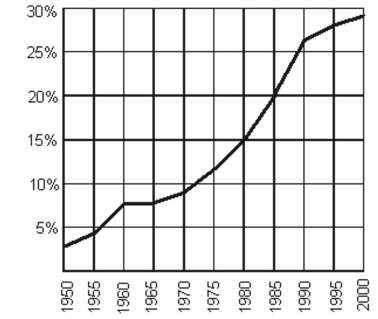 -Between what two years is the difference in function values equal to 5%?
(Multiple Choice)
4.8/5  (38)
(38)
Evaluate a Function
Evaluate the function at the given value of the independent variable and simplify.
-
(Multiple Choice)
4.8/5 (40)
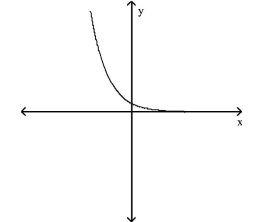
Use the Vertical Line Test to Identify Functions
Use the vertical line test to determine whether or not the graph is a graph in which y is a function of x.
-
(Multiple Choice)
4.8/5 (40)
Filters
- Essay(0)
- Multiple Choice(0)
- Short Answer(0)
- True False(0)
- Matching(0)