Exam 4: Displaying and Describing Categorical Data
Exam 2: Data26 Questions
Exam 3: Surveys and Sampling Multiple Choice21 Questions
Exam 4: Displaying and Describing Categorical Data32 Questions
Exam 5: Displaying and Describing Quantitative Data17 Questions
Exam 6: Correlation and Linear Regression24 Questions
Exam 7: Randomness and Probability29 Questions
Exam 8: Random Variables and Probability Models20 Questions
Exam 9: Sampling Distributions and Confidence Intervals for Proportions16 Questions
Exam 10: Testing Hypotheses About Proportions16 Questions
Exam 11: Confidence Intervals and Hypothesis20 Questions
Exam 12: Comparing Two Groups13 Questions
Exam 13: Inference for Counts: Chi-Square17 Questions
Exam 14: Inference for Regression18 Questions
Exam 15: Multiple Regression18 Questions
Exam 16: Introduction to Data Mining20 Questions
Select questions type
A full service brokerage firm gathered information on how their clients were investing for retirement.Based on age, clients were categorized according to where the largest
Percentage of their retirement portfolio was invested and shown in the table below. 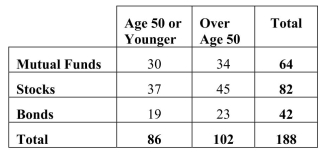 The percentage of clients who are over age 50 and invest in mutual funds is
(Multiple Choice)
4.9/5  (24)
(24)
Prepare an appropriate chart to display the marginal distribution of age.
(Essay)
4.8/5 (37)
A regional survey was carried out to gauge public opinion on the controversial Arizona Immigration Law (results shown below).How many respondents are
Republican and favor the law? 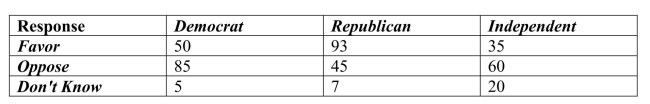
(Multiple Choice)
4.8/5 (44)
A regional survey was carried out to gauge public opinion on the controversial Arizona Immigration Law.Based on the results displayed in the table below, what
Percent of respondents is Independent? 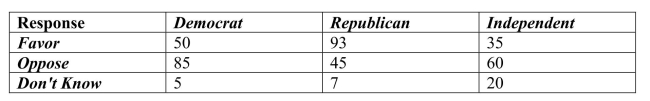
(Multiple Choice)
4.8/5 (27)
Prepare an appropriate chart to display the marginal distribution of brands.
(Essay)
4.9/5 (38)
A restaurant uses comment cards to get feedback from its customers about newly added items to the menu.It recently introduced homemade organic veggie burgers.
Customers who tried the new burger were asked if they would order it again.The data
Are summarized in the table below.What percentage of customers would definitely order
The veggie burger again? 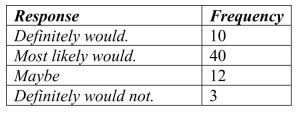
(Multiple Choice)
4.8/5 (35)
A full service brokerage firm gathered information on how their clients were investing for retirement.Based on age, clients were categorized according to where the largest
Percentage of their retirement portfolio was invested and shown in the table below. 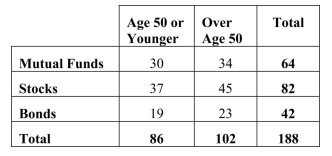 Of the clients who invest in mutual funds, the percentage over age 50 is
(Multiple Choice)
4.9/5 (29)
Here is a pie chart for data collected about clients of brokerage firm. 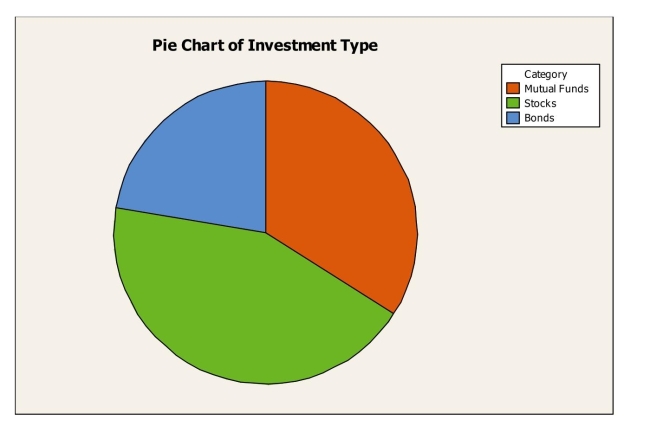 The pie chart shows
(Multiple Choice)
4.8/5 (35)
The following is a bar chart summarizing consumer preferences for various brands of digital cameras. 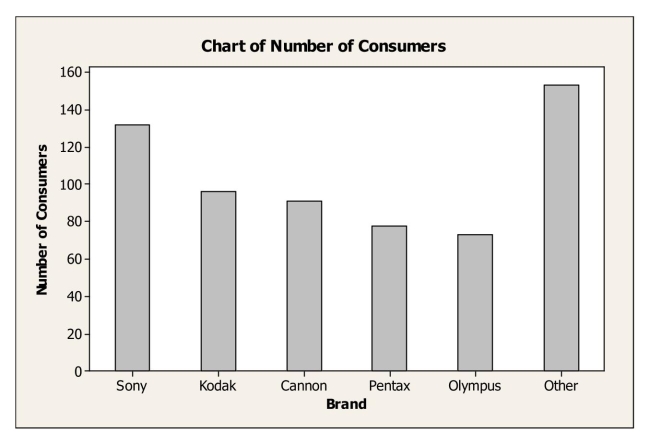
(Multiple Choice)
4.9/5 (20)
Consider the following side by side bar chart for the data above: 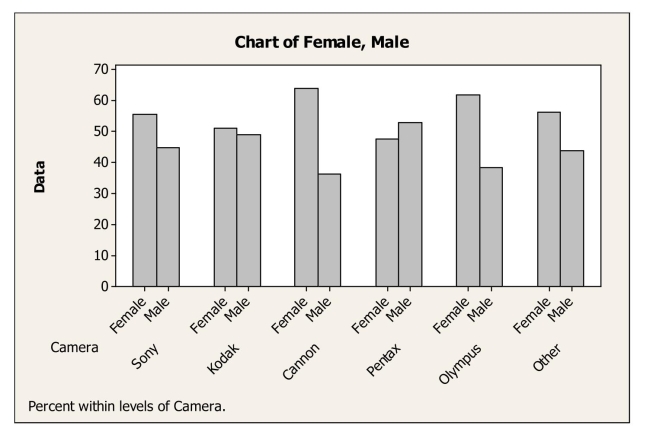 Does the chart indicate that brand preference is independent of gender? Explain.
(Essay)
4.9/5 (35)
A full service brokerage firm gathered information on how their clients were investing for retirement.Based on age, clients were categorized according to where the
Largest percentage of their retirement portfolio was invested and shown in the table
Below. 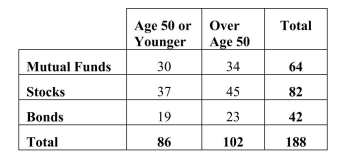
(Multiple Choice)
4.8/5 (36)
Filters
- Essay(0)
- Multiple Choice(0)
- Short Answer(0)
- True False(0)
- Matching(0)