Exam 4: Displaying and Describing Categorical Data
Exam 2: Data26 Questions
Exam 3: Surveys and Sampling Multiple Choice21 Questions
Exam 4: Displaying and Describing Categorical Data32 Questions
Exam 5: Displaying and Describing Quantitative Data17 Questions
Exam 6: Correlation and Linear Regression24 Questions
Exam 7: Randomness and Probability29 Questions
Exam 8: Random Variables and Probability Models20 Questions
Exam 9: Sampling Distributions and Confidence Intervals for Proportions16 Questions
Exam 10: Testing Hypotheses About Proportions16 Questions
Exam 11: Confidence Intervals and Hypothesis20 Questions
Exam 12: Comparing Two Groups13 Questions
Exam 13: Inference for Counts: Chi-Square17 Questions
Exam 14: Inference for Regression18 Questions
Exam 15: Multiple Regression18 Questions
Exam 16: Introduction to Data Mining20 Questions
Select questions type
A full service brokerage firm gathered information on how their clients were investing for retirement.Based on age, clients were categorized according to where the largest
Percentage of their retirement portfolio was invested and shown in the table below. 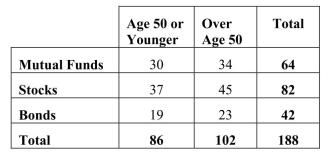 4-14 Chapter 4 Displaying and Describing Categorical Data
Of the clients over age 50, the percentage who invest in mutual funds is
4-14 Chapter 4 Displaying and Describing Categorical Data
Of the clients over age 50, the percentage who invest in mutual funds is
Free
(Multiple Choice)
4.9/5  (28)
(28)
Correct Answer: Verified
B
Consider the following side by side bar chart for the data above: 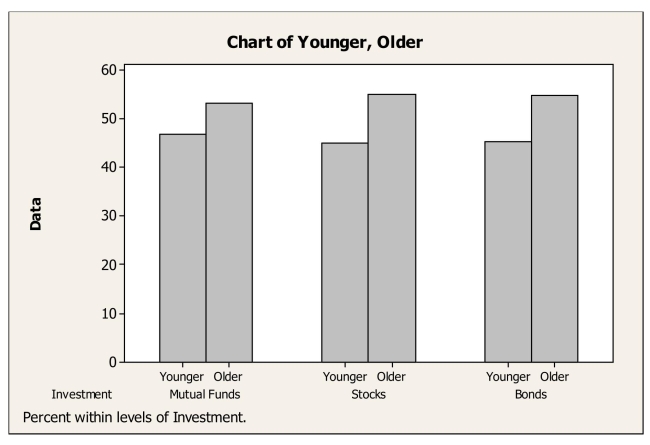 Does the chart indicate that mode of investment is independent of age? Explain.
Free
(Essay)
4.8/5 (32)
Correct Answer:Verified
The way clients invest for retirement does seem to be independent of age.These data
provide little indication of a difference in mode of investing for retirement based on
clients' ages at this firm.
A full service brokerage firm gathered information on how their clients were investing
for retirement.Based on age, clients were categorized according to where the largest
percentage of their retirement portfolio was invested.The table below summarized the
data. 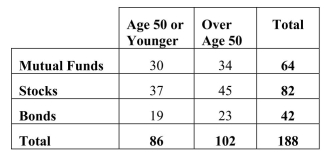 -Find each of the following percentages.
a.What percent of the clients are over age 50 who invests in mutual funds?
b.What percent of clients over age 50 invest in mutual funds?
c.What percent of the mutual fund investors are over age 50?
-Find each of the following percentages.
a.What percent of the clients are over age 50 who invests in mutual funds?
b.What percent of clients over age 50 invest in mutual funds?
c.What percent of the mutual fund investors are over age 50?
Free
(Essay)
4.9/5 (28)
Correct Answer:Verified
a.18.1% (34/188)
b.33.3% (34/102)
c.53.1% (34/64)
A large national retailer of electronics conducted a survey to determine consumer preferences for various brands of digital cameras and the data are summarized in the table
Shown below. 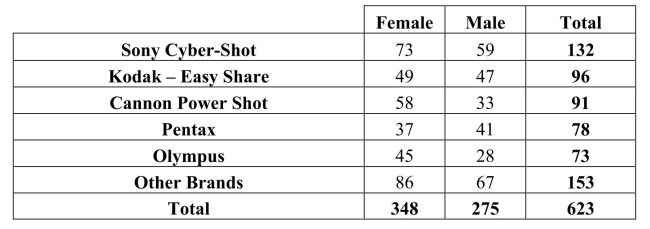 The percentage of consumers who are male and prefer Pentax is
(Multiple Choice)
4.8/5 (35)
Find each of the following percentages.
a.What percent of the responses were males who prefer Pentax?
b.What percent of the male responses prefer Pentax?
c.What percent of the consumers who choose Pentax were males?
(Essay)
4.7/5 (30)
Identify the variables and tell whether each is categorical or quantitative.
(Essay)
4.9/5 (37)
A regional survey was carried out to gauge public opinion on the controversial Arizona Immigration Law.The results are displayed in the segmented bar chart below.
Which of the following statements is true? 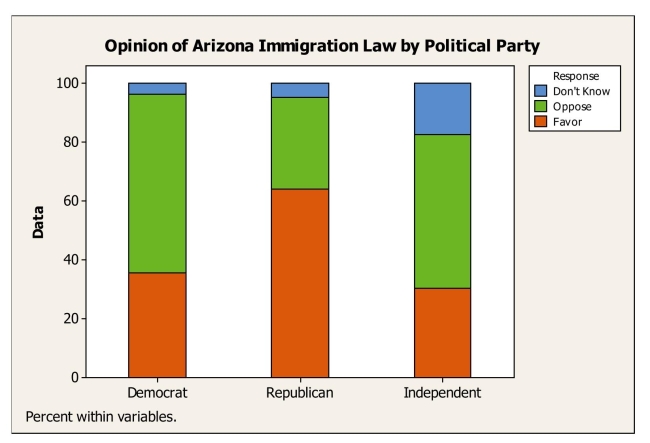
(Multiple Choice)
4.8/5 (26)
A full service brokerage firm gathered information on how their clients were investing
for retirement.Based on age, clients were categorized according to where the largest
percentage of their retirement portfolio was invested.The table below summarized the
data.
-What is the marginal distribution of age?
(Essay)
4.8/5 (30)
A restaurant uses comment cards to get feedback from its customers about newly added items to the menu.It recently introduced homemade organic veggie burgers.
Customers who tried the new burger were asked if they would order it again.The data
Are summarized in the table below.What percentage of customers would most likely or
Definitely order the veggie burger again? 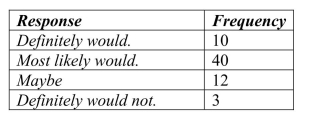
(Multiple Choice)
4.7/5 (32)
A full service brokerage firm gathered information on how their clients were investing
for retirement.Based on age, clients were categorized according to where the largest
percentage of their retirement portfolio was invested.The table below summarized the
data.
-Identify the variables and tell whether each is categorical or quantitative.
(Essay)
4.7/5 (32)
A regional survey was carried out to gauge public opinion on the controversial Arizona Immigration Law (results shown below).Of respondents who oppose the law,
What percent is Democrat? 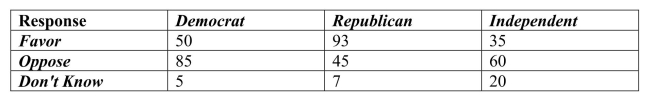
(Multiple Choice)
4.9/5 (42)
Based on the side-by-side bar chart summarizing consumer preferences for various brands of digital cameras by gender, which of the following statements is (are) true? 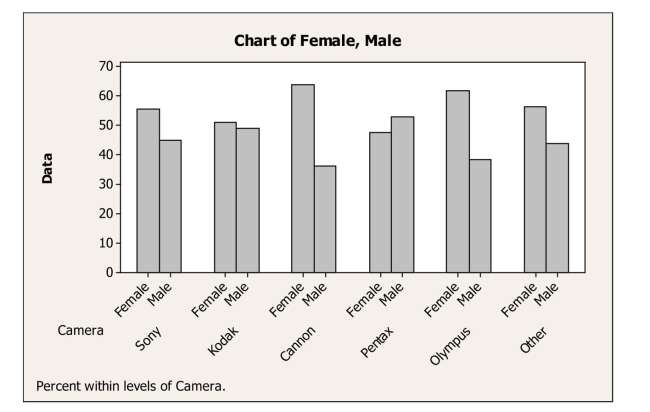
(Multiple Choice)
4.8/5 (35)
A large national retailer of electronics conducted a survey to determine consumer preferences for various brands of digital cameras and the data are summarized in the table
Shown below.  Of the consumers who are male, the percentage who prefer Pentax is
(Multiple Choice)
4.7/5 (28)
A regional survey was carried out to gauge public opinion on the controversial Arizona Immigration Law (results shown below).What percent oppose the law? 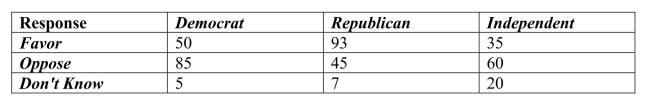
(Multiple Choice)
4.7/5 (28)
A automobile marketing firm conducts a study to see what types of cars people owned before buying an American car.The results are shown below. 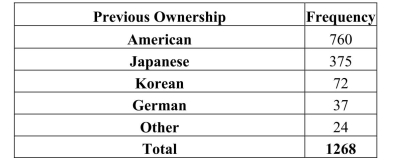 The relative frequency of those who owned Japanese cars previously who now bought
American cars is
The relative frequency of those who owned Japanese cars previously who now bought
American cars is
(Multiple Choice)
4.9/5 (32)
In May, 2010, the Pew Research Center for the People & the Press carried out a national survey to gauge opinion on the Arizona Immigration Law.Responses (Favor,
Oppose, Don't Know) were examined according to groups defined by political party
Affiliation (Democrat, Republican, Independent).Which of the following would be
Appropriate for displaying these data?
(Multiple Choice)
4.9/5 (35)
A regional survey was carried out to gauge public opinion on the controversial Arizona Immigration Law (results shown below).Of respondents who are Democrat,
What percent oppose the law? 
(Multiple Choice)
4.9/5 (34)
Write a sentence or two about the conditional relative frequency distribution of mode
of investment for clients age 50 or younger.
(Essay)
4.9/5 (30)
A large national retailer of electronics conducted a survey to determine consumer preferences for various brands of digital cameras and the data are summarized in the table
Shown below.Of the consumers who prefer Pentax, what percentage is male? 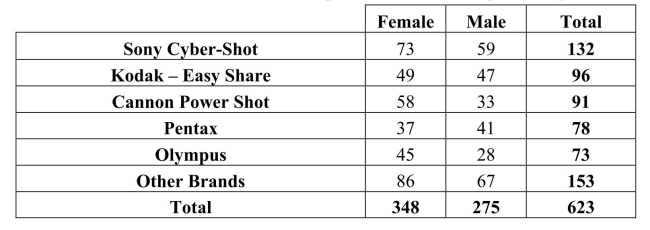
(Multiple Choice)
4.7/5 (49)
Write a sentence or two about the conditional relative frequency distribution of the
brands among female respondents.
(Essay)
4.9/5 (39)
Filters
- Essay(0)
- Multiple Choice(0)
- Short Answer(0)
- True False(0)
- Matching(0)