Exam 5: Displaying and Describing Quantitative Data
Exam 2: Data26 Questions
Exam 3: Surveys and Sampling Multiple Choice21 Questions
Exam 4: Displaying and Describing Categorical Data32 Questions
Exam 5: Displaying and Describing Quantitative Data17 Questions
Exam 6: Correlation and Linear Regression24 Questions
Exam 7: Randomness and Probability29 Questions
Exam 8: Random Variables and Probability Models20 Questions
Exam 9: Sampling Distributions and Confidence Intervals for Proportions16 Questions
Exam 10: Testing Hypotheses About Proportions16 Questions
Exam 11: Confidence Intervals and Hypothesis20 Questions
Exam 12: Comparing Two Groups13 Questions
Exam 13: Inference for Counts: Chi-Square17 Questions
Exam 14: Inference for Regression18 Questions
Exam 15: Multiple Regression18 Questions
Exam 16: Introduction to Data Mining20 Questions
Select questions type
Consider the five number summary of hourly wages ($) for a sample of advertising / promotion managers. 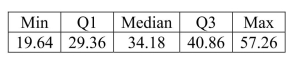
Free
(Multiple Choice)
4.9/5  (32)
(32)
Correct Answer: Verified
B
Here is the five number summary for salaries of U.S.marketing managers. 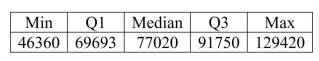 The IQR is
Free
(Multiple Choice)
4.9/5 (31)
Correct Answer:Verified
B
The following boxplots show monthly sales revenue figures ($ thousands) for a discount office supply company with locations in three different regions of the U.S.
(Northeast, Southeast, and West).Which of the following statements is true? 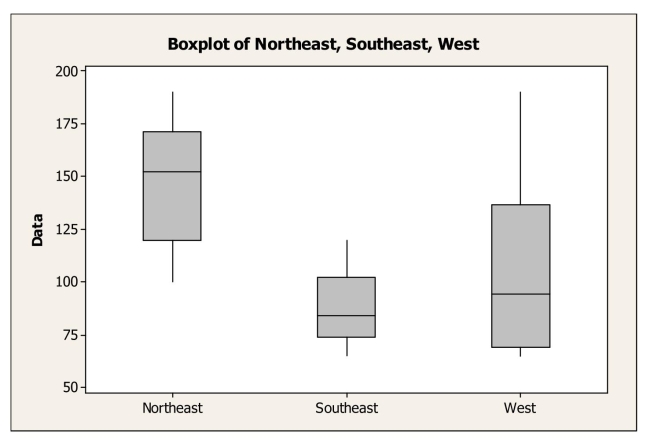 5-20 Chapter 5 Displaying and Describing Quantitative Data
Free
(Multiple Choice)
4.9/5 (34)
Correct Answer:Verified
B
The following boxplots show monthly sales revenue figures ($ thousands) for a discount office supply company with locations in three different regions of the U.S.
(Northeast, Southeast, and West).Which of the following statements is false? 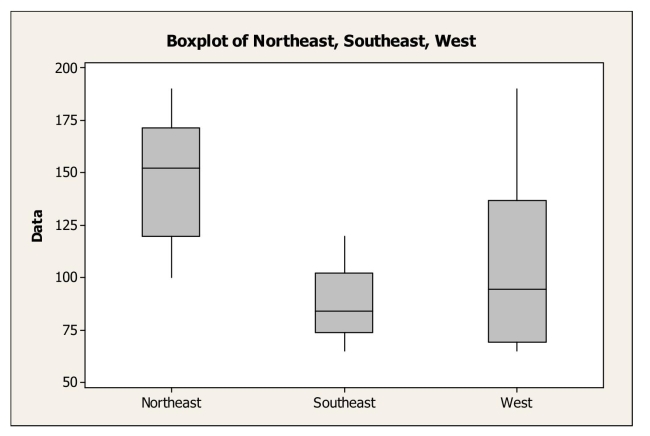
(Multiple Choice)
4.9/5 (41)
The following table shows closing share prices for a small sample of companies. 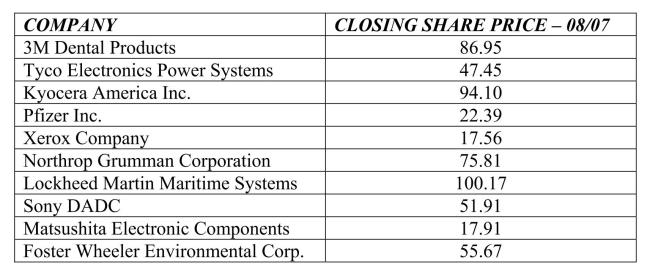 The z score for the share price for Matsushita Electronic Components is
(Multiple Choice)
4.9/5 (35)
The following table shows total assets ($ billion) for a small sample of U.S.banks. 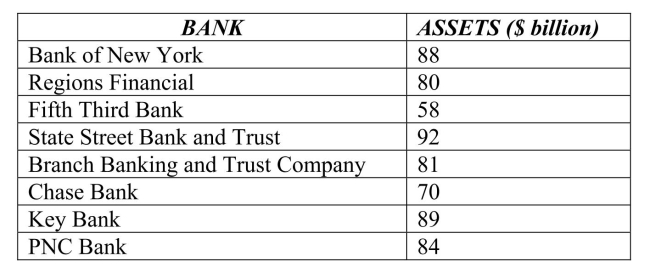 The mean for these data is
(Multiple Choice)
4.9/5 (32)
The following table shows closing share prices for a small sample of companies. 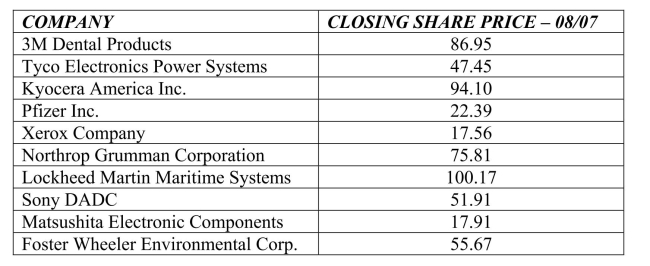 The mean closing share price is
(Multiple Choice)
4.9/5 (38)
Below is a histogram of salaries (in $) for a sample of U.S.marketing managers. 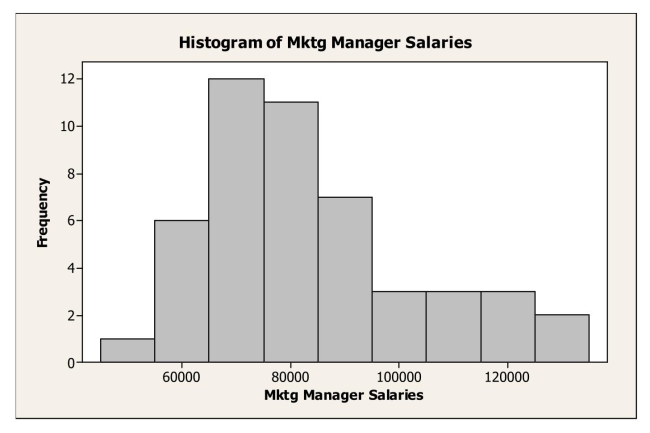 The most appropriate measure of central tendency for these data is the
(Multiple Choice)
4.9/5 (34)
Consider the five number summary for salaries of U.S.marketing managers. 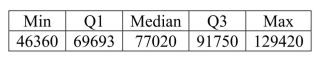 Suppose the marketing manager who was earning $129,420 got a raise and is now earning $140,000.Which of the following statement is true?
(Multiple Choice)
4.7/5 (31)
The following table shows closing share prices for a small sample of companies. 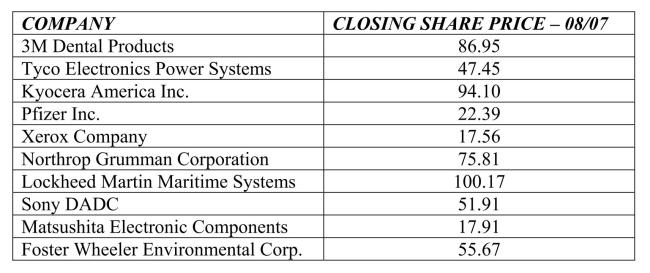 The standard deviation in closing share prices is
(Multiple Choice)
4.7/5 (40)
The following table shows total assets ($ billion) for a small sample of U.S.banks. 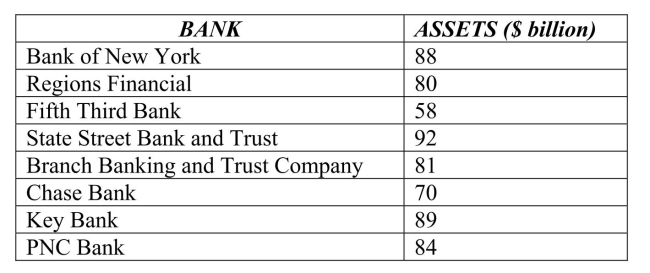 The standard deviation for these data is
(Multiple Choice)
4.8/5 (40)
The following table shows total assets ($ billion) for a small sample of U.S.banks. 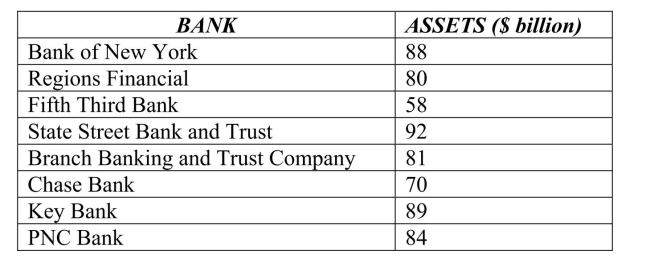 The z- score for the total assets of Fifth Third Bank is
(Multiple Choice)
4.8/5 (43)
Consider the five number summary of hourly wages ($) for a sample of sales managers.Suppose the mean hourly wage is $38.50.What can we say about the shape
Of the distribution? 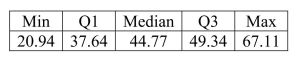
(Multiple Choice)
4.9/5 (33)
The ASQ (American Society for Quality) regularly conducts a salary survey of its membership, primarily quality management professionals.Based on the most recently
Published mean and standard deviation, a quality control specialist calculated the z-score
Associated with his own salary and found it was -2.50.This tells him that his salary is
(Multiple Choice)
4.8/5 (42)
Below is a histogram of salaries (in $) for a sample of U.S.marketing managers. 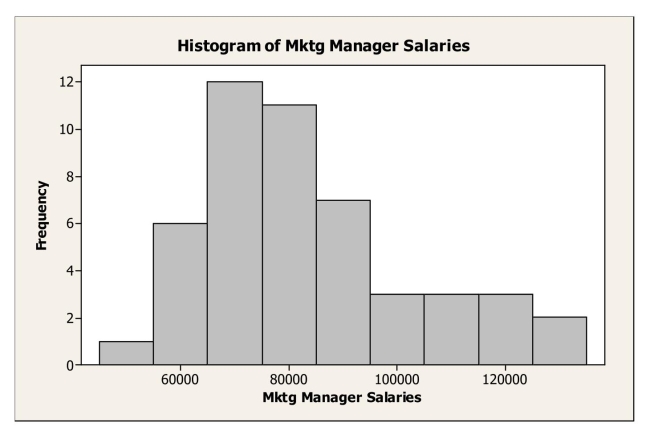 The shape of this distribution is
(Multiple Choice)
4.8/5 (36)
Consider the five number summary of hourly wages ($) for a sample of sales managers.  The IQR for these data is
(Multiple Choice)
4.8/5 (32)
Consider the five number summary of hourly wages ($) for a sample of sales managers. 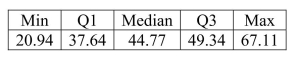
(Multiple Choice)
4.8/5 (32)
Filters
- Essay(0)
- Multiple Choice(0)
- Short Answer(0)
- True False(0)
- Matching(0)