Exam 3: Business Fluctuations: Aggregate Demand and Supply
Exam 1: The Big Ideas in Economics103 Questions
Exam 2: The Power of Trade and Comparative Advantage169 Questions
Exam 3: Business Fluctuations: Aggregate Demand and Supply114 Questions
Exam 4: Equilibrium: How Supply and Demand Determine Prices105 Questions
Exam 5: Elasticity and Its Applications153 Questions
Exam 6: Taxes and Subsidies100 Questions
Exam 7: The Price System: Signals, Speculation, and Prediction149 Questions
Exam 8: Price Ceilings and Floors199 Questions
Exam 9: International Trade78 Questions
Exam 10: Externalities: When the Price Is Not Right146 Questions
Exam 11: Costs and Profit Maximization Under Competition126 Questions
Exam 12: Competition and the Invisible Hand29 Questions
Exam 13: Monopoly144 Questions
Exam 14: Price Discrimination and Pricing Strategy152 Questions
Exam 15: Oligopoly and Game Theory127 Questions
Exam 16: Competing for Monopoly: the Economics of Network Goods51 Questions
Exam 17: Monopolistic Competition and Advertising143 Questions
Exam 18: Labor Markets148 Questions
Exam 19: Public Goods and the Tragedy of the Commons153 Questions
Exam 20: Political Economy and Public Choice151 Questions
Exam 21: Economics, Ethics, and Public Policy143 Questions
Exam 22: Managing Incentives140 Questions
Exam 23: Stock Markets and Personal Finance53 Questions
Exam 24: Asymmetric Information: Moral Hazard and Adverse Selection133 Questions
Exam 25: Consumer Choice141 Questions
Exam 26: Gdp and the Measurement of Progress135 Questions
Exam 27: The Wealth of Nations and Economic Growth155 Questions
Exam 28: Growth, Capital Accumulation, and the Economics of Ideas: Catching up Vs the Cutting Edge145 Questions
Exam 29: Saving, Investment, and the Financial System146 Questions
Exam 30: Supply and Demand183 Questions
Exam 31: Unemployment and Labor Force Participation96 Questions
Exam 32: Inflation and the Quantity Theory of Money165 Questions
Exam 33: Transmission and Amplification Mechanisms133 Questions
Exam 34: The Federal Reserve System and Open Market Operations144 Questions
Exam 35: Monetary Policy139 Questions
Exam 36: The Federal Budget: Taxes and Spending158 Questions
Select questions type
In the early 1980s, movie rentals averaged $5 a night; by the early 1990s that average was $1 per night. This is an example of a supply curve shifter based on:
(Multiple Choice)
4.7/5  (28)
(28)
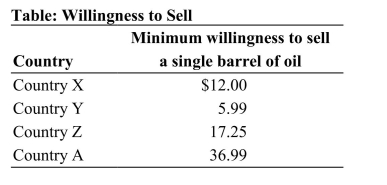 Reference: Ref 3-3 (Table: Willingness to Sell) Refer to the table. Which country is earning the least amount of producer surplus at a market price of $52 per barrel of oil?
(Multiple Choice)
4.8/5 (42)
The quantity of DVDs that people plan to buy this month depends on all of the following EXCEPT the:
(Multiple Choice)
4.8/5 (42)
It is widely known that the rapidly expanding corn-ethanol industry is quickly increasing the price of corn on world markets. Given this, many farmers have begun to grow corn more intensively. For instance, some producers who currently pursue a corn-soybean rotation (planting corn one year and soybeans the next) might shift to a corn-corn-soybean rotation (planting corn two years in a row and then planting soybeans in the third). Continuous production of corn (planting corn every year on the same plot of land) is another possibility. Explain what impact this explosion in the market for corn may have on the market for soybeans. In particular, will those that produce soybeans exclusively be better off, worse off, or unaffected as a result of the increase in corn prices?
(Essay)
4.9/5 (42)
Assume that spaghetti is an inferior good for most people. As their incomes increase, all other things held constant, the:
(Multiple Choice)
4.9/5 (44)
For each of the following changes, determine whether there will be a change in supply (that is, a shift of the supply curve) or a change in quantity supplied (that is, no shift of the supply curve). I. a change in the resource cost II. a change in producer expectations III. a change in price IV. a change in technology V. the number of sellers
(Essay)
4.9/5 (36)
(Figure: Earned Producer Surplus) Refer to the figure. Calculate the total dollar amount of producer surplus earned in this market at a price of $100. 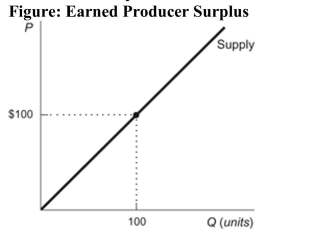
(Multiple Choice)
4.9/5 (40)
(Figure: Supply Curve) Refer to the figure. A vertical reading of the figure indicates that: 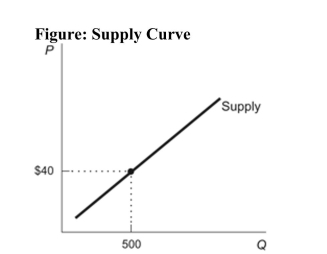
(Multiple Choice)
4.8/5 (32)
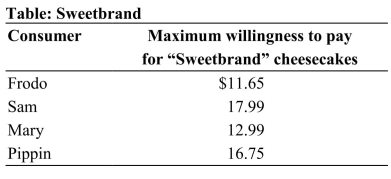 Reference: Ref 3-1 (Table: Sweetbrand) The table shows the maximum consumer willingness to pay for "Sweetbrand" cheesecakes. Which of the four consumers receives the smallest consumer surplus, if the market price of the cheesecakes is $12.50 each?
(Multiple Choice)
4.8/5 (42)
Which of the following choices contains only factors that would cause a demand curve for a normal good to shift to the right?
(Multiple Choice)
4.8/5 (44)
(Figure: Demand Shift) Which of the following factors would cause the change in the figure? Figure: Demand Shift 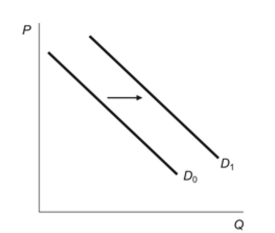 I. an increase in the price of a complement good II. an increase in production costs III. an increase in the price of a substitute good IV. an increase in income for an inferior good
(Multiple Choice)
4.8/5 (33)
Weather forecasters predict that a major winter storm will strike your town within the next few days. Which of the following would NOT occur based upon the expected storm?
(Multiple Choice)
4.9/5 (37)
Michael graduates from college and his income increases by $40,000 a year. Other things held constant, he decreases the quantity of pizza he buys. For Michael, pizza is:
(Multiple Choice)
4.9/5 (41)
(Figure: Generic Market Producer Surplus) Refer to the figure. Calculate the total dollar amount of producer surplus earned in this market if the market price is $60. 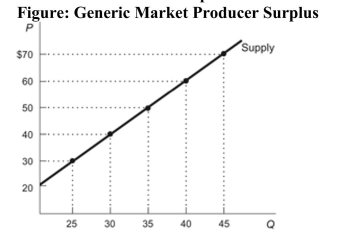
(Multiple Choice)
4.8/5 (38)
(Figure: Demand Shift) Refer to the figure. Which of the following factors would cause the change in the figure? 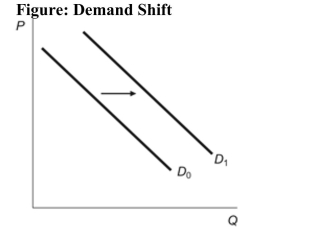 I. a decrease in the price of a complement good II. a decrease in the price of the product III. a decrease in the price of a substitute good IV. an increase in taxes
(Multiple Choice)
4.8/5 (27)
Which of the following statements is TRUE? I. Consumer surplus is the difference between the maximum price a consumer is willing to pay for a good or service and its market price. II. Mr. Bill is willing to pay $10 for two pounds of clay. If the market price per pound of clay is $2.50, his consumer surplus is $7.50. III. Total consumer surplus is represented graphically by the area beneath the demand curve and above the market price.
(Multiple Choice)
4.9/5 (43)
Recall the discussion in your textbook about the supply curve for oil. What explains why the supply curve for oil is positively sloped?
(Multiple Choice)
4.9/5 (35)
Filters
- Essay(0)
- Multiple Choice(0)
- Short Answer(0)
- True False(0)
- Matching(0)