Exam 3: Data Presentation
Exam 1: Introduction to Statistical Terms and Concepts in Health Data Management50 Questions
Exam 2: Basic Math Concepts, Central Tendency, and Dispersion27 Questions
Exam 3: Data Presentation50 Questions
Exam 4: Administrative Data65 Questions
Exam 5: Clinical Facility Data50 Questions
Exam 6: Public Health Data49 Questions
Exam 7: Departmental Data46 Questions
Exam 8: Financial Data55 Questions
Exam 9: Scrubbing and Mapping Data50 Questions
Exam 10: Predicting Data50 Questions
Select questions type
Which type of data presentation method is below? 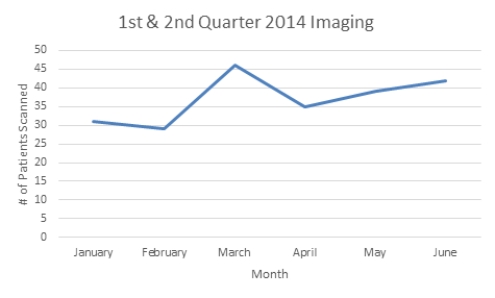
Free
(Multiple Choice)
4.8/5  (32)
(32)
Correct Answer: Verified
D
The location of the data point that is to be plotted is called a _______.
Free
(Multiple Choice)
4.8/5 (44)
Correct Answer:Verified
D
A ______ presents data categories in percentages of a whole.
Free
(Multiple Choice)
4.9/5 (35)
Correct Answer:Verified
C
Which type of presentation method shows actual data points that can be used to examine relationships (like medicine and test results)?
(Multiple Choice)
4.9/5 (38)
You cannot perform mathematical calculations on which type of data?
(Multiple Choice)
4.8/5 (33)
A ____ also uses the x and y axis but uses columns instead of a coordinate of the two axes.
(Multiple Choice)
4.8/5 (29)
What uses icons instead of numbers to represent units of data?
(Multiple Choice)
4.8/5 (31)
The horizontal axis that is used to place the independent variables is also called what?
(Multiple Choice)
4.7/5 (41)
What is it called when all the data you have fits into all the categories you have?
(Multiple Choice)
4.8/5 (37)
A _____ table works by automatically extracting the information you want to see and summarizing the information in a smaller, separate table.
(Multiple Choice)
4.8/5 (28)
This names the individual columns by captions or column titles.
(Multiple Choice)
4.8/5 (39)
In a pie chart, all the slices will always add up to what percent?
(Multiple Choice)
4.7/5 (27)
One feature that data analysts use frequently to summarize the data in a lengthy table is called a ______ table.
(Multiple Choice)
4.9/5 (36)
A coding supervisor has been trying to manage the workload of an increase in the number of charts that need to be coded from a recent corresponding increase in admissions. While her coders have been getting the charts coded, she has also seen the percentage of miscoded charts increase. She suspects that it might be from the charts coded with overtime hours. What is the dependent variable?
(Multiple Choice)
4.7/5 (37)
Use the graph below to answer this question: Around what time did the patient reach the maximum beats per minute? 
(Multiple Choice)
5.0/5 (34)
Use the graph below to answer this question: Which bpm interval contains the most data points? 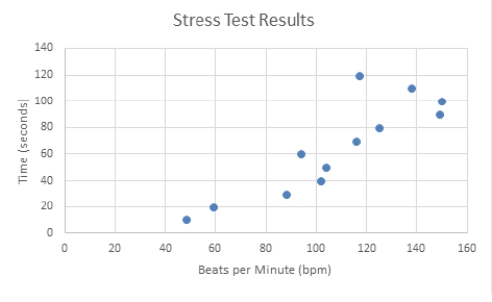
(Multiple Choice)
4.8/5 (37)
Which type of data representation is best used to show comparisons of the proportions of categories to each other?
(Multiple Choice)
4.7/5 (44)
Filters
- Essay(0)
- Multiple Choice(0)
- Short Answer(0)
- True False(0)
- Matching(0)