Exam 16: Externalities
Exam 1: First Principles233 Questions
Exam 2: Economic Models: Trade-Offs and Trade 25382 Questions
Exam 3: Supply and Demand290 Questions
Exam 4: Consumer and Producer Surplus224 Questions
Exam 5: Price Controls and Quotas: Meddling With Markets227 Questions
Exam 6: Elasticity300 Questions
Exam 7: Taxes298 Questions
Exam 8: International Trade272 Questions
Exam 9: Decision Making by Individuals Firms201 Questions
Exam 10: The Rational Consumer372 Questions
Exam 11: Behind the Supply Curve: Inputs and Costs362 Questions
Exam 12: Perfect Competition and the Supply Curve355 Questions
Exam 13: Monopoly350 Questions
Exam 14: Oligopoly294 Questions
Exam 15: Monopolistic Competition and Product Differentiation262 Questions
Exam 16: Externalities199 Questions
Exam 17: Public Goods Common Resources224 Questions
Exam 18: The Economics of the Welfare140 Questions
Exam 19: Factor Markets and the Distribution of Income369 Questions
Exam 20: Uncertainty, Risk, and Private Information202 Questions
Select questions type
Use the following to answer questions:
Figure: Efficiency and Pollution 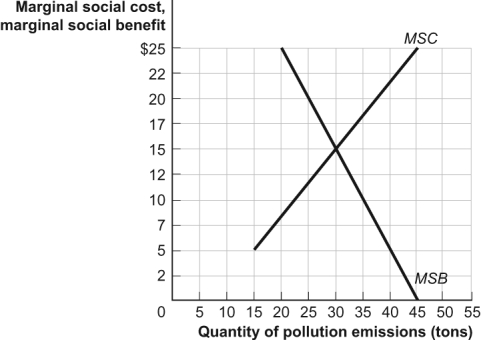 -(Figure: Efficiency and Pollution) Look at the figure Efficiency and Pollution. If this market produced _____ tons of pollution, then _____.
Free
(Multiple Choice)
4.9/5  (32)
(32)
Correct Answer: Verified
A
Use the following to answer questions: 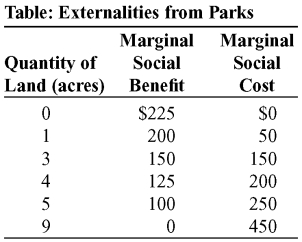 -(Table: Externalities from Parks) The table Externalities from Parks shows the marginal social benefit and the marginal social cost of preserving various amounts of land in a city for a public park. If 1 acre is dedicated to the park, this outcome is _____ because _____.
Free
(Multiple Choice)
4.8/5 (30)
Correct Answer:Verified
C
Network externalities are often:
Free
(Multiple Choice)
4.9/5 (41)
Correct Answer:Verified
B
Use the following to answer questions:
Figure: City with Two Polluters 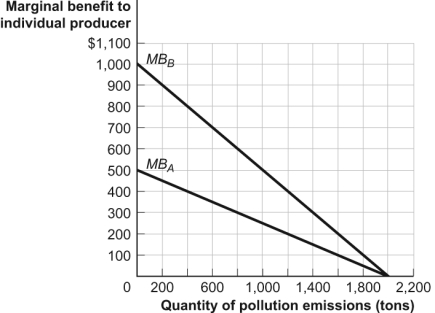 -(Figure: City with Two Polluters) Look at the figure City with Two Polluters. If the government does not intervene in the pollution market, equilibrium will occur where firm A produces _____ tons and firm B produces _____ tons of pollution, for a total of _____ tons.
(Multiple Choice)
4.9/5 (43)
Which of the following is an environmental policy based on tradable pollution permits?
(Multiple Choice)
4.9/5 (42)
Use the following to answer questions:
-(Table: Externalities from Parks) The table Externalities from Parks shows the marginal social benefit and the marginal social cost of preserving various amounts of land in a city for a public park. Without government intervention, the amount of land dedicated to the public park will be _____ acres.
(Multiple Choice)
4.8/5 (34)
Use the following to answer questions:
Figure: The Socially Optimal Quantity of Pollution 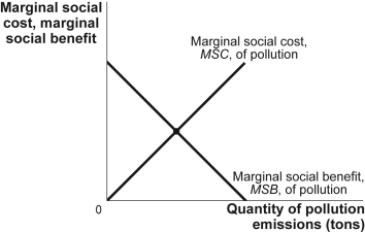 -(Figure: The Socially Optimal Quantity of Pollution) In the figure The Socially Optimal Quantity of Pollution, the optimal level of pollution is:
(Multiple Choice)
4.8/5 (23)
Use the following to answer question:
Figure: The Optimal Quantity of Pollution 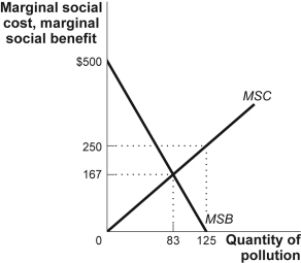 -(Figure: The Optimal Quantity of Pollution) The figure The Optimal Quantity of Pollution shows the marginal social cost (MSC) and marginal social benefit (MSB) for firms that pollute the air with sulfur dioxide. Using the figure, the optimal Pigouvian tax per unit of pollution is:
(Multiple Choice)
4.7/5 (33)
Use the following to answer questions:
Figure: Model of a Competitive Market 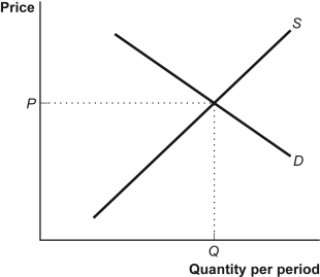 -(Figure: Model of a Competitive Market) Given the figure Model of a Competitive Market, if a tax is imposed on sellers, the equilibrium price will _____ and the equilibrium quantity will _____.
(Multiple Choice)
4.9/5 (36)
Use the following to answer questions:
Scenario: Private and External Benefits
A small community finds that tidy lawns and neighborhoods provide both private and external benefits. They determine that the marginal private benefit (MPB) of lawns can be represented by the equation MPB = 50 - 0.5Q, where Q is the number of hours spent on keeping lawns tidy. The marginal private cost (MPC) of such lawn upkeep is represented by the equation MPC = 0.5Q, where Q is again the number of hours engaged in lawn upkeep.
-(Scenario: Private and External Benefits) Look at the scenario Private and External Benefits. The community estimates the marginal social benefit from lawn upkeep to be $15. Given this information, what is the socially optimal amount of lawn upkeep for this community?
(Multiple Choice)
4.9/5 (33)
Use the following to answer questions: 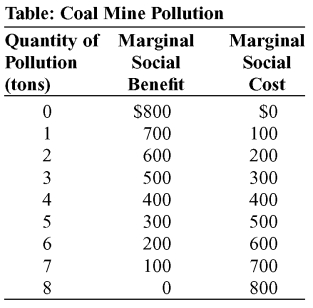 -(Table: Coal Mine Pollution) The table Coal Mine Pollution shows the marginal social benefit and cost of various amounts of pollution from a coal mine. The market-determined quantity of pollution is _____ tons.
(Multiple Choice)
4.8/5 (35)
Use the following to answer questions:
-(Table: Coal Mine Pollution) The table Coal Mine Pollution shows the marginal social benefit and cost of various amounts of pollution from a coal mine. The efficient quantity of pollution is _____ tons.
(Multiple Choice)
4.8/5 (33)
Use the following to answer questions:
Figure: City with Two Polluters
-(Figure: City with Two Polluters) Look at the figure City with Two Polluters. If the government imposed an emissions tax of $400, firm A would produce _____ tons of emissions and firm B would produce _____ tons of emissions.
(Multiple Choice)
4.8/5 (54)
Automobile emissions generate pollution, have costs, and cause discomfort to residents of a city. In this case:
(Multiple Choice)
4.9/5 (43)
Filters
- Essay(0)
- Multiple Choice(0)
- Short Answer(0)
- True False(0)
- Matching(0)