Exam 5: Applying Consumer Theory
Exam 1: Introduction59 Questions
Exam 2: Supply and Demand150 Questions
Exam 3: Applying the Supply-And-Demand Model124 Questions
Exam 4: Consumer Choice125 Questions
Exam 5: Applying Consumer Theory118 Questions
Exam 6: Firms and Production128 Questions
Exam 7: Costs122 Questions
Exam 8: Competitive Firms and Markets127 Questions
Exam 9: Applying the Competitive Model156 Questions
Exam 10: General Equilibrium and Economic Welfare122 Questions
Exam 11: Monopoly147 Questions
Exam 12: Pricing and Advertising135 Questions
Exam 13: Oligopoly and Monopolistic Competition128 Questions
Exam 14: Game Theory109 Questions
Exam 15: Factor Markets103 Questions
Exam 16: Interest Rates, Investments, and Capital Markets120 Questions
Exam 17: Uncertainty122 Questions
Exam 18: Externalities, Open-Access, and Public Goods123 Questions
Exam 19: Asymmetric Information119 Questions
Exam 20: Contracts and Moral Hazards107 Questions
Select questions type
Suppose the quantity of x is measured on the horizontal axis. If the price consumption curve is vertical when the price of x changes, then the demand for x is
(Multiple Choice)
4.9/5  (32)
(32)
If a consumer is compensated for the income effect that occurs when the price of a good increases, then his demand curves can never slope upward.
(True/False)
4.8/5 (35)
If a good is considered a normal good, the demand curve will shift ________ when income increases because ________.
(Multiple Choice)
4.8/5 (48)
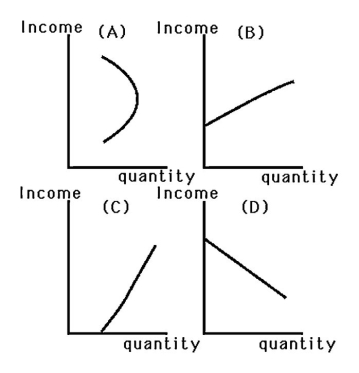 -Even though Mary's income is very low, she makes sure that she purchases enough milk for her family to drink. As her income rises, she does buy more milk. Which graph in the above figure best represents Mary's Engel curve for milk?
(Multiple Choice)
4.9/5 (31)
Draw two graphs, one directly above the other. On the upper graph, label the vertical axis Good X and label the horizontal axis Good Y. On the lower graph, label the vertical axis the Price of good Y and label the horizontal axis Good Y. In the upper graph, show the income and substitution effects of a decrease in the Price of good Y when Y is a Giffen good. Draw the corresponding demand curve for Good Y in the lower graph.
(Essay)
4.9/5 (31)
If a person supplies fewer hours of labor in response to a wage increase, then
(Multiple Choice)
4.8/5 (29)
If a person supplies more hours of labor in response to a wage increase, then
(Multiple Choice)
4.8/5 (41)
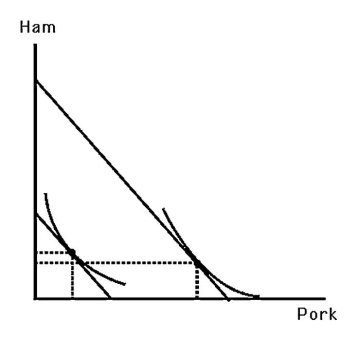 -The above figure shows Larry's indifference map and budget lines for ham and pork. Which of the following statements is TRUE?
(Multiple Choice)
4.9/5 (36)
In response to an increase in the wage rate, the income effect will usually cause a person to
(Multiple Choice)
4.9/5 (36)
A movement upward along an upward sloping Engel curve corresponds to
(Multiple Choice)
4.9/5 (37)
The above figure shows Bobby's indifference map for juice and snacks. Also shown are three budget lines resulting from different prices for snacks assuming he has $20 to spend on these goods. Which of the following points are on Bobby's demand curve for snacks?
(Multiple Choice)
4.8/5 (37)
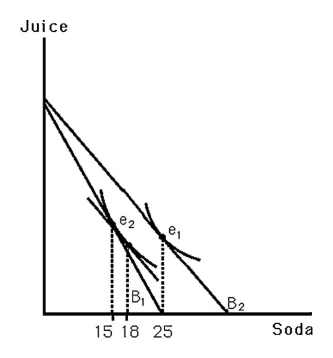 -The above figure shows Bobby's indifference map for soda and juice. B1 indicates his original budget line. B2 indicates his budget line resulting from a decrease in the price of soda. What change in quantity best represents his income effect?
(Multiple Choice)
4.7/5 (40)
Wealthy people will tend to have vertical labor supply curves
(Multiple Choice)
4.8/5 (40)
-The above figure shows Bobby's indifference map for soda and juice. B1 indicates his original budget line. B2 indicates his budget line resulting from an increase in the price of soda. From the graph, one can conclude that
(Multiple Choice)
4.8/5 (28)
-The above figure shows Larry's indifference map and budget lines for ham and pork. Which of the following statements is TRUE?
(Multiple Choice)
4.9/5 (38)
Using the CPI to compensate workers for inflation is appropriate because, in the face of a change in relative prices, people should be allowed to purchase the same bundle as they did before the price changes.
(True/False)
4.8/5 (46)
Filters
- Essay(0)
- Multiple Choice(0)
- Short Answer(0)
- True False(0)
- Matching(0)