Exam 5: Applying Consumer Theory
Exam 1: Introduction59 Questions
Exam 2: Supply and Demand150 Questions
Exam 3: Applying the Supply-And-Demand Model124 Questions
Exam 4: Consumer Choice125 Questions
Exam 5: Applying Consumer Theory118 Questions
Exam 6: Firms and Production128 Questions
Exam 7: Costs122 Questions
Exam 8: Competitive Firms and Markets127 Questions
Exam 9: Applying the Competitive Model156 Questions
Exam 10: General Equilibrium and Economic Welfare122 Questions
Exam 11: Monopoly147 Questions
Exam 12: Pricing and Advertising135 Questions
Exam 13: Oligopoly and Monopolistic Competition128 Questions
Exam 14: Game Theory109 Questions
Exam 15: Factor Markets103 Questions
Exam 16: Interest Rates, Investments, and Capital Markets120 Questions
Exam 17: Uncertainty122 Questions
Exam 18: Externalities, Open-Access, and Public Goods123 Questions
Exam 19: Asymmetric Information119 Questions
Exam 20: Contracts and Moral Hazards107 Questions
Select questions type
Draw a graph with Goods Per Day on the vertical axis and Leisure Hours Per Day increasing from left to right on the horizontal axis. Show that a person who works can work fewer hours and increase utility when the wage rate increases.
(Essay)
4.8/5  (36)
(36)
An individual derives utility from games, g (y-axis), and toy airplanes, a (x-axis), described by the utility function U(g,a)= g0.6a0.4. The price per game is $20 and the price of toy airplanes is $10. Using the slope of the income consumption curve (ICC), determine whether games and toy airplanes are normal or inferior goods when income increases from $100 to $200.
(Multiple Choice)
4.8/5 (30)
Suppose a graph is drawn to show a consumer's preferences for football tickets and basketball tickets. The quantity of football tickets is measured on the horizontal axis. If the price-consumption curve is horizontal when the price of football tickets changes, then
(Multiple Choice)
4.8/5 (51)
Suppose a person's utility for leisure (L)and consumption (Y)can be expressed as U = Y ∗ L and this person has no non-labor income. Assuming a wage rate of $10 per hour, show what happens to the person's labor supply when the person wins a lottery prize of $100 per day.
(Essay)
4.9/5 (39)
Under which of the following conditions will there be no substitution bias in the CPI?
(Multiple Choice)
4.9/5 (36)
For an inferior good, if the income effect more than offsets the substitution effect, we call that good
(Multiple Choice)
4.8/5 (39)
Richard receives government transfer payments and currently consumes 5 guns and 6 goose livers. Assume the price of guns decreases by 10% and the price of goose liver increases by 20%. The government raises Richard's transfer payments so he can still afford 5 guns and 6 goose livers. Does this constitute a true cost-of-living adjustment (COLA)?
(Multiple Choice)
4.9/5 (36)
When the price of a good changes, the substitution effect can be found by comparing the equilibrium quantities purchased
(Multiple Choice)
4.9/5 (40)
The amount of money one would have to take from a consumer to harm her by as much as the price increase is called
(Multiple Choice)
4.8/5 (38)
Which graph in the above figure best represents a good that is an inferior good at some income levels, and a normal good at other income levels?
(Multiple Choice)
4.8/5 (36)
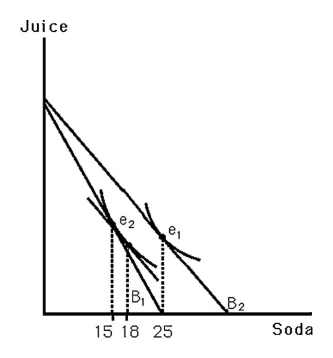 -The above figure shows Bobby's indifference map for soda and juice. B1 indicates his original budget line. B2 indicates his budget line resulting from a decrease in the price of soda. What change in quantity best represents his substitution effect?
(Multiple Choice)
4.8/5 (35)
Median household income is $50,000 per year. The typical household spends about $125 per year on milk, which has an income elasticity of about 0.07. From this information, we can conclude that
(Multiple Choice)
4.8/5 (37)
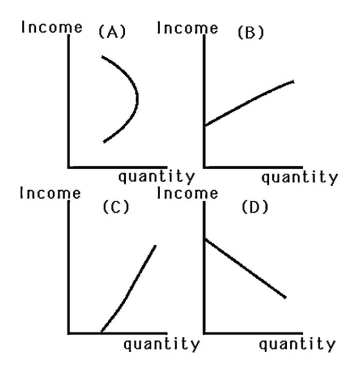 -When John's income was low, he could not afford to dine out and would respond to a pay raise by purchasing more frozen dinners. Now that his income is high, a pay raise causes him to dine out more often and buy fewer frozen dinners. Which graph in the above figure best represents John's Engel curve for dining out?
(Multiple Choice)
5.0/5 (39)
What is the benefit of understanding the income and the substitution effects?
(Multiple Choice)
4.9/5 (44)
When the price of a good changes, the income effect can be found by comparing the equilibrium quantities purchased
(Multiple Choice)
4.8/5 (41)
Filters
- Essay(0)
- Multiple Choice(0)
- Short Answer(0)
- True False(0)
- Matching(0)