Exam 5: Applying Consumer Theory
Exam 1: Introduction59 Questions
Exam 2: Supply and Demand150 Questions
Exam 3: Applying the Supply-And-Demand Model124 Questions
Exam 4: Consumer Choice125 Questions
Exam 5: Applying Consumer Theory118 Questions
Exam 6: Firms and Production128 Questions
Exam 7: Costs122 Questions
Exam 8: Competitive Firms and Markets127 Questions
Exam 9: Applying the Competitive Model156 Questions
Exam 10: General Equilibrium and Economic Welfare122 Questions
Exam 11: Monopoly147 Questions
Exam 12: Pricing and Advertising135 Questions
Exam 13: Oligopoly and Monopolistic Competition128 Questions
Exam 14: Game Theory109 Questions
Exam 15: Factor Markets103 Questions
Exam 16: Interest Rates, Investments, and Capital Markets120 Questions
Exam 17: Uncertainty122 Questions
Exam 18: Externalities, Open-Access, and Public Goods123 Questions
Exam 19: Asymmetric Information119 Questions
Exam 20: Contracts and Moral Hazards107 Questions
Select questions type
When income increases by 1%, the quantity demanded of a good decreases by 2%. What is the income elasticity of the good? Is the good normal or inferior? Why?
(Essay)
4.7/5  (42)
(42)
The above figure shows Bobby's indifference map for juice and snacks. Also shown are three budget lines resulting from different prices for snacks. Bobby's demand for snacks is
(Multiple Choice)
4.9/5 (41)
Suppose a person's utility for leisure (L)and consumption (Y)can be expressed as U = Y + L0.5. Show what happens to the person's labor supply curve when the income tax is cut from 70 percent to 30 percent. Denote hours worked as H and wage per hour as w.
(Essay)
4.9/5 (36)
Suppose that the interest rate paid to savers increases. As a result, Tom wishes to save less. This suggests that, for Tom,
(Multiple Choice)
4.8/5 (40)
If Bobby thinks that leisure is an inferior good, then his labor supply curve
(Multiple Choice)
4.9/5 (33)
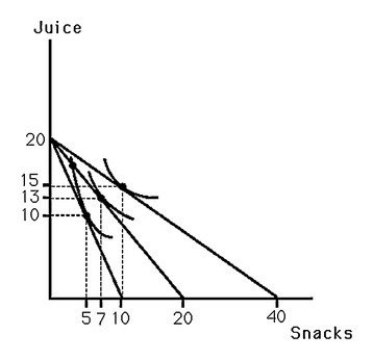 -The above figure shows Bobby's indifference map for juice and snacks. It also shows three budget lines resulting from different prices for snacks. Juice and snacks are
(Multiple Choice)
4.8/5 (43)
The nominal price of a desk increased from $20 in 2005 to $65 in 2016. The Consumer Price Index (CPI)was 125 in 2005 and 250 in 2016. We can say that
(Multiple Choice)
5.0/5 (26)
An increase in unearned income always creates a disincentive to work.
(True/False)
4.9/5 (32)
The Consumer Price Index (CPI)measures inflation for every individual.
(Multiple Choice)
4.8/5 (35)
Three individuals have $1000 and identical preferences for gum, g, and cigarettes, s, as measured by the utility function U(g,s)= 10g0.9s0.1. The price of gum is $9 and the price of cigarettes is $12. What is the market surplus/shortage at a price of $12 when the supply of cigarettes is 5?
(Multiple Choice)
4.9/5 (31)
An individual derives utility from consuming "all other goods," g, and clean air (measured by the reduction in particulate matter per m3), a, as measured by the utility function U(g,a)= g0.6a0.4. The price of consumer goods equals $20 and the price of clean air (abatement)equals $10. What is the slope of the Engel curve when income increases from $100 to $200?
(Multiple Choice)
4.9/5 (29)
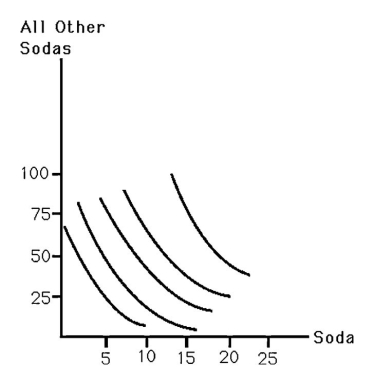 -The above figure shows a consumer's indifference curves for soda and all other goods. Assuming a budget of $100, derive the consumer's demand for soda for prices of $4 and $10 per case of soda. Estimate the price elasticity of demand for soda.
(Essay)
4.7/5 (39)
Recent data has shown that income and volunteer time are positively related. Assuming that volunteer time is included in leisure time, what could explain this observation?
(Multiple Choice)
4.8/5 (38)
Under which of the following conditions will there be no substitution bias in the CPI?
(Multiple Choice)
4.8/5 (34)
Newspaper accounts of the U.S. labor market often point out that many people are working more hours than their parents did. What might explain this phenomenon?
(Multiple Choice)
4.9/5 (34)
A good may be inferior at some income levels and normal at others.
(True/False)
4.9/5 (38)
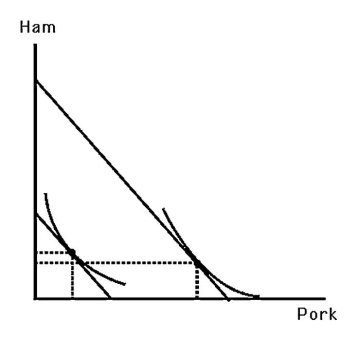 -The above figure shows Larry's indifference map and budget lines for ham and pork. Which of the following statements is TRUE?
(Multiple Choice)
4.9/5 (37)
Suppose the typical consumer only purchases food and clothing, and her utility can be expressed as  . Currently, food costs $5 per unit and clothing costs $2 per unit. Her income is $70. If the price of food increases to $6, compare the resulting Laspeyres price index with a true cost of living index.
(Essay)
4.9/5 (41)
Filters
- Essay(0)
- Multiple Choice(0)
- Short Answer(0)
- True False(0)
- Matching(0)