Exam 4: Supply and Demand: An Initial Look
Exam 1: What Is Economics?227 Questions
Exam 2: The Economy: Myth and Reality150 Questions
Exam 3: The Fundamental Economic Problem: Scarcity and Choice250 Questions
Exam 4: Supply and Demand: An Initial Look308 Questions
Exam 5: Consumer Choice: Individual and Market Demand202 Questions
Exam 6: Demand and Elasticity209 Questions
Exam 7: Production, Inputs, and Cost: Building Blocks for Supply Analysis216 Questions
Exam 8: Output, Price, and Profit: The Importance of Marginal Analysis189 Questions
Exam 9: Securities: Business Finance, and the Economy: The Tail that Wags the Dog?198 Questions
Exam 10: The Firm and the Industry under Perfect Competition208 Questions
Exam 11: Monopoly203 Questions
Exam 12: Between Competition and Monopoly225 Questions
Exam 13: Limiting Market Power: Regulation and Antitrust152 Questions
Exam 14: The Case for Free Markets I: The Price System220 Questions
Exam 15: The Shortcomings of Free Markets212 Questions
Exam 16: The Market's Prime Achievement: Innovation and Growth110 Questions
Exam 17: Externalities, the Environment, and Natural Resources217 Questions
Exam 18: Taxation and Resource Allocation219 Questions
Exam 19: Pricing the Factors of Production228 Questions
Exam 20: Labor and Entrepreneurship: The Human Inputs223 Questions
Exam 21: Poverty, Inequality, and Discrimination167 Questions
Exam 22: An Introduction to Macroeconomics211 Questions
Exam 23: The Goals of Macroeconomic Policy207 Questions
Exam 24: Economic Growth: Theory and Policy223 Questions
Exam 25: Aggregate Demand and the Powerful Consumer214 Questions
Exam 26: Demand-Side Equilibrium: Unemployment or Inflation?210 Questions
Exam 27: Bringing in the Supply Side: Unemployment and Inflation?223 Questions
Exam 28: Managing Aggregate Demand: Fiscal Policy205 Questions
Exam 29: Money and the Banking System219 Questions
Exam 30: Monetary Policy: Conventional and Unconventional205 Questions
Exam 31: The Financial Crisis and the Great Recession61 Questions
Exam 32: The Debate over Monetary and Fiscal Policy214 Questions
Exam 33: Budget Deficits in the Short and Long Run210 Questions
Exam 34: The Trade-Off between Inflation and Unemployment214 Questions
Exam 35: International Trade and Comparative Advantage226 Questions
Exam 36: The International Monetary System: Order or Disorder?213 Questions
Exam 37: Exchange Rates and the Macroeconomy214 Questions
Select questions type
If new manufacturers enter the computer industry, then, holding all other things constant,
(Multiple Choice)
5.0/5  (29)
(29)
Figure 4-8
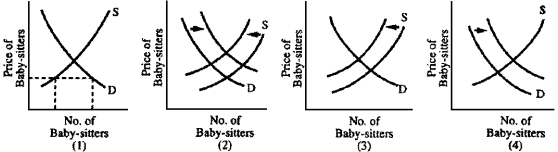 -Women today are having more babies than women did fifteen years ago.The result is that mothers today have trouble finding baby-sitters and are shocked at what they must pay for child care.Which graph in Figure 4-8 best illustrates how the situation has changed?
(Multiple Choice)
4.8/5 (40)
A demand curve shows the relationship between price and quantity demanded only so long as all other things are held constant.
(True/False)
4.8/5 (41)
Equilibrium is reached where there is no inherent force causing quantity supplied or quantity demanded to change.
(True/False)
4.8/5 (26)
Any factor that shifts the demand curve to the left but does not affect the supply curve will lower the equilibrium price and raise the equilibrium quantity.
(True/False)
4.9/5 (38)
An increase in supply will have what effect on equilibrium price and quantity?
(Multiple Choice)
4.8/5 (42)
The price for labor is the wage rate.What happens to the quantity of labor demanded if wages increase?
(Multiple Choice)
4.9/5 (39)
"Demand" is a series of quantities demanded, one for each person in the market.
(True/False)
4.8/5 (39)
A minimum wage law may cause unemployment among low-skill workers.
(True/False)
4.8/5 (41)
A shift in the demand curve for sailboats resulting from an increase in incomes will lead to
(Multiple Choice)
4.8/5 (36)
Exhibit 4-1
The following are the equations for the supply and demand curves in the market for weezils:
Demand:
Supply:
where is the quantity demanded, Qs is the quantity supplied, and P is the price per weezil in dollars.
-Refer to Exhibit 4-1.According to the data given, when the market is in Equilibrium, how many weezils are sold?
(Multiple Choice)
4.9/5 (30)
The demand for computers has risen dramatically at the same time that the unit cost of production has decreased.As a result, we can expect
(Multiple Choice)
4.8/5 (32)
Even though prices may change frequently, they can be expected to gravitate toward equilibrium.
(True/False)
4.8/5 (39)
Firms often seek to borrow money to expand their capital stock, and the price they pay for the money is the interest rate.What happens to the quantity of money supplied if the interest rate increases?
(Multiple Choice)
4.9/5 (41)
From 2007 to 2008, the Federal Reserve System reduced interest rates, the price that borrowers pay.As a result, economists expected demand for money to
(Multiple Choice)
4.8/5 (36)
Suppose that in a free market 2,000 patients purchase an operation to receive an artificial heart at a price of $500,000 per operation.Without the heart, each patient will die.The government decides this price is too high and imposes a maximum price of $200,000.Everything else equal,
(Multiple Choice)
5.0/5 (36)
Filters
- Essay(0)
- Multiple Choice(0)
- Short Answer(0)
- True False(0)
- Matching(0)