Exam 4: Supply and Demand: An Initial Look
Exam 1: What Is Economics?227 Questions
Exam 2: The Economy: Myth and Reality150 Questions
Exam 3: The Fundamental Economic Problem: Scarcity and Choice250 Questions
Exam 4: Supply and Demand: An Initial Look308 Questions
Exam 5: Consumer Choice: Individual and Market Demand202 Questions
Exam 6: Demand and Elasticity209 Questions
Exam 7: Production, Inputs, and Cost: Building Blocks for Supply Analysis216 Questions
Exam 8: Output, Price, and Profit: The Importance of Marginal Analysis189 Questions
Exam 9: Securities: Business Finance, and the Economy: The Tail that Wags the Dog?198 Questions
Exam 10: The Firm and the Industry under Perfect Competition208 Questions
Exam 11: Monopoly203 Questions
Exam 12: Between Competition and Monopoly225 Questions
Exam 13: Limiting Market Power: Regulation and Antitrust152 Questions
Exam 14: The Case for Free Markets I: The Price System220 Questions
Exam 15: The Shortcomings of Free Markets212 Questions
Exam 16: The Market's Prime Achievement: Innovation and Growth110 Questions
Exam 17: Externalities, the Environment, and Natural Resources217 Questions
Exam 18: Taxation and Resource Allocation219 Questions
Exam 19: Pricing the Factors of Production228 Questions
Exam 20: Labor and Entrepreneurship: The Human Inputs223 Questions
Exam 21: Poverty, Inequality, and Discrimination167 Questions
Exam 22: An Introduction to Macroeconomics211 Questions
Exam 23: The Goals of Macroeconomic Policy207 Questions
Exam 24: Economic Growth: Theory and Policy223 Questions
Exam 25: Aggregate Demand and the Powerful Consumer214 Questions
Exam 26: Demand-Side Equilibrium: Unemployment or Inflation?210 Questions
Exam 27: Bringing in the Supply Side: Unemployment and Inflation?223 Questions
Exam 28: Managing Aggregate Demand: Fiscal Policy205 Questions
Exam 29: Money and the Banking System219 Questions
Exam 30: Monetary Policy: Conventional and Unconventional205 Questions
Exam 31: The Financial Crisis and the Great Recession61 Questions
Exam 32: The Debate over Monetary and Fiscal Policy214 Questions
Exam 33: Budget Deficits in the Short and Long Run210 Questions
Exam 34: The Trade-Off between Inflation and Unemployment214 Questions
Exam 35: International Trade and Comparative Advantage226 Questions
Exam 36: The International Monetary System: Order or Disorder?213 Questions
Exam 37: Exchange Rates and the Macroeconomy214 Questions
Select questions type
Figure 4-4
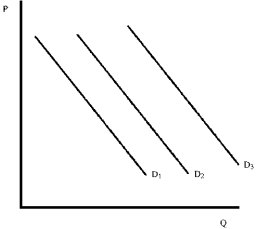 -Assume that Figure 4-4 shows demand for new houses.A decrease in income of buyers will change demand from
(Multiple Choice)
4.8/5  (34)
(34)
A cold winter will increase the quantity of heating fuel demanded at every price.
(True/False)
4.8/5 (32)
The imposition of price ceilings on a market often results in
(Multiple Choice)
4.8/5 (32)
American consumers decide to boycott grapes in support of the farm workers' union.Everything else being equal, the
(Multiple Choice)
4.7/5 (36)
Figure 4-21
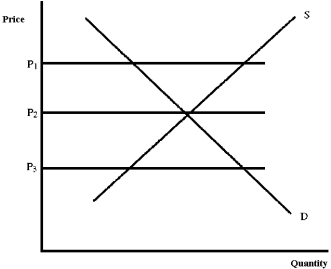 -At price P₃ in Figure 4-21, what will tend to happen?
(Multiple Choice)
4.9/5 (39)
Figure 4-23
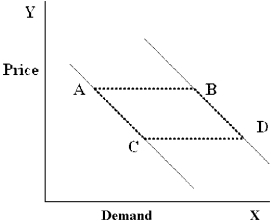 -In Figure 4-23, which movement will be caused by changes in income?
(Multiple Choice)
4.9/5 (43)
A market will experience a ____ when the price is above equilibrium and a ____ when the price is below equilibrium.
(Multiple Choice)
4.9/5 (40)
Professional baseball teams in the United States use only wooden bats.If aluminum bats were permitted, the likely result would be a
(Multiple Choice)
4.8/5 (30)
Figure 4-12
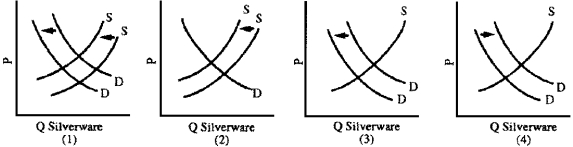 -The silverware industry has been in serious decline since the 1980s.Family dining habits are less formal so people purchase less silverware.Also, in 2006-2008, the price of silver increased from $5 to $20 per ounce.Which graph in Figure 4-12 best illustrates these developments?
(Multiple Choice)
4.9/5 (44)
Rent controls are most often designed to protect the investment made by apartment building owners.
(True/False)
4.8/5 (36)
Figure 4-22
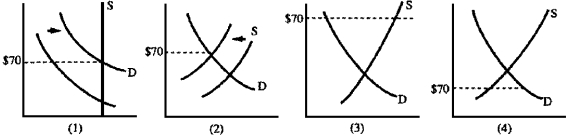 -Because of falling oil prices in the past, Libya could afford fewer imported goods.Government controls were established to limit imports of cigarettes.In 1985, the market price of Marlboros rose to $70 a carton.Which graph in Figure 4-22 best depicts this situation?
(Multiple Choice)
4.8/5 (35)
A decrease in supply will have what effect on equilibrium price and quantity?
(Multiple Choice)
4.7/5 (39)
The invention of machinery that can double the amount of gold extracted from raw ore will likely lead mining companies to
(Multiple Choice)
4.9/5 (39)
Explain the effect of the following changes on equilibrium price and quantity of a commodity:
(a)increase in average incomes.
(b)increase in population.
(Essay)
4.7/5 (40)
Filters
- Essay(0)
- Multiple Choice(0)
- Short Answer(0)
- True False(0)
- Matching(0)