Exam 3: Demand and Supply
Exam 1: What Is Economics483 Questions
Exam 2: The Economic Problem443 Questions
Exam 3: Demand and Supply515 Questions
Exam 4: Measuring Gdp and Economic Growth395 Questions
Exam 5: Monitoring Jobs and Inflation409 Questions
Exam 6: Economic Growth352 Questions
Exam 7: Finance, Saving, and Investment227 Questions
Exam 8: Money, the Price Level, and Inflation578 Questions
Exam 9: The Exchange Rate and the Balance of Payments489 Questions
Exam 10: Aggregate Supply and Aggregate Demand426 Questions
Exam 11: Expenditure Multipliers469 Questions
Exam 12: The Business Cycle, Inflation, and Deflation409 Questions
Exam 13: Fiscal Policy263 Questions
Exam 14: Monetary Policy229 Questions
Exam 15: International Trade Policy208 Questions
Select questions type
Many Southern farmers face a choice between planting peanuts or cotton. In 2014, farmers anticipated higher prices for cotton. In the market for peanuts in 2014, there would be ________ in the supply of peanuts, which leads to ________ in the price of peanuts and ________ in the quantity of peanuts.
(Multiple Choice)
4.8/5  (44)
(44)
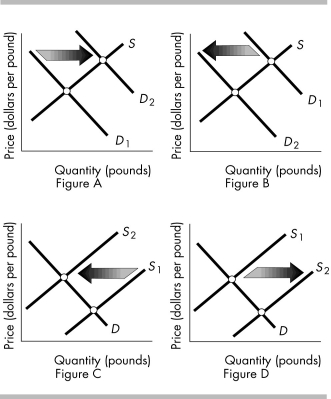 -The above figures show the market for oranges. Which figure(s) shows the effect of new successful advertising campaigns to eat more oranges?
(Multiple Choice)
4.8/5 (34)
For normal goods which of the following explains why demand curves slope downward?
(Multiple Choice)
4.9/5 (39)
A consumer might consider in-line skates and elbow-pads to be
(Multiple Choice)
4.9/5 (34)
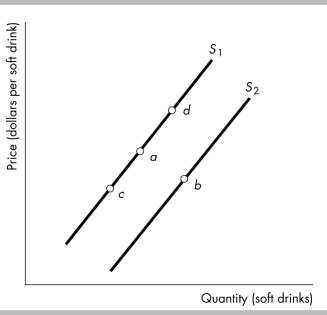 -The figure above shows supply curves for soft drinks. Suppose the economy is at point a. A movement to point b could be the result of
(Multiple Choice)
4.8/5 (38)
Kelly graduates and her income increases by $25,000 a year. Other things remaining the same, she increases the quantity of clothes she buys. For Kelly, clothes are
(Multiple Choice)
4.9/5 (33)
Suppose the equilibrium price for soft drinks is $1.00. If the current price in the soft drink market is $1.25 each
(Multiple Choice)
4.8/5 (35)
The law of demand implies that if nothing else changes, there is
(Multiple Choice)
5.0/5 (40)
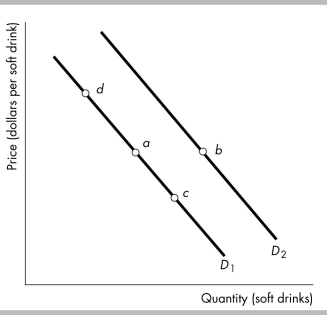 -Consider the demand curves for soft drinks shown in the figure above. Moving from point a to point c means that
(Multiple Choice)
4.9/5 (39)
Which of the following raises the equilibrium price and increases the equilibrium quantity of used cars?
(Multiple Choice)
4.9/5 (39)
When both the demand for a good increases and the supply of the good increases, the equilibrium quantity definitely increases.
(True/False)
4.9/5 (38)
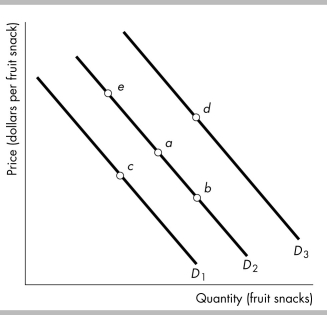 -The figure above shows the demand for fruit snacks. Which movement reflects an increase in income if fruit snacks are an inferior good?
(Multiple Choice)
4.8/5 (40)
Consumers expect that the price of a gallon of gasoline will rise next week. As a result
(Multiple Choice)
4.9/5 (34)
If the price per bushel of apples increased from $7.00 to $8.00 because of a poor harvest, the
(Multiple Choice)
4.7/5 (33)
Good A and good B are substitutes in production. The demand for good A increases so that the price of good A rises. The increase in the price of good A shifts the
(Multiple Choice)
4.8/5 (38)
The initial supply and demand curves for a good are illustrated in the above figure. If there is a rise in the price of a factor of production used to produce the good, then the new equilibrium price
(Multiple Choice)
4.8/5 (44)
If the demand and supply curves are described by the following equations P = a - bQ and P = c + dQ, respectively, the equilibrium quantity is Q* = (a - c) / (b + d).
(True/False)
4.9/5 (37)
An increase in technology for producing personal computers leads to
(Multiple Choice)
4.9/5 (30)
Filters
- Essay(0)
- Multiple Choice(0)
- Short Answer(0)
- True False(0)
- Matching(0)