Exam 3: Demand and Supply
Exam 1: What Is Economics483 Questions
Exam 2: The Economic Problem443 Questions
Exam 3: Demand and Supply515 Questions
Exam 4: Measuring Gdp and Economic Growth395 Questions
Exam 5: Monitoring Jobs and Inflation409 Questions
Exam 6: Economic Growth352 Questions
Exam 7: Finance, Saving, and Investment227 Questions
Exam 8: Money, the Price Level, and Inflation578 Questions
Exam 9: The Exchange Rate and the Balance of Payments489 Questions
Exam 10: Aggregate Supply and Aggregate Demand426 Questions
Exam 11: Expenditure Multipliers469 Questions
Exam 12: The Business Cycle, Inflation, and Deflation409 Questions
Exam 13: Fiscal Policy263 Questions
Exam 14: Monetary Policy229 Questions
Exam 15: International Trade Policy208 Questions
Select questions type
Which of the following decreases the supply of restaurant meals?
(Multiple Choice)
4.9/5  (36)
(36)
If both demand and supply increase, what will be the effect on the equilibrium price and quantity?
(Multiple Choice)
4.9/5 (43)
Which of the following shifts the demand curve for hot dogs leftward?
(Multiple Choice)
4.8/5 (37)
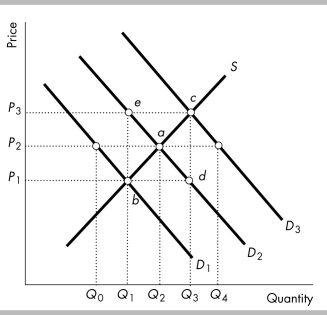 -In the above figure, if D2 is the demand curve, then a price of P3 would result in
(Multiple Choice)
4.8/5 (30)
If the supply of bottled water decreases and at the same time the demand for bottled water increases, the equilibrium price ________ and the equilibrium quantity ________.
(Multiple Choice)
4.9/5 (31)
What will happen to the equilibrium price and equilibrium quantity of ice cream cones when consumers' incomes decrease?
(Multiple Choice)
5.0/5 (41)
When there is a shortage in the market, the quantity sold is
(Multiple Choice)
4.8/5 (39)
The money price of a pizza is $12 per pizza and the money price of a taco is $2 per taco. The relative price of a pizza is
(Multiple Choice)
4.8/5 (39)
If a market is NOT in equilibrium, then which of the following is likely to occur?
(Multiple Choice)
4.7/5 (32)
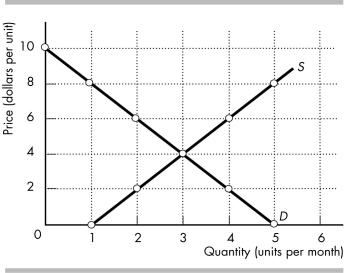 -In the figure above, if the price is $8 a unit, is there a shortage or surplus and what is the amount of any shortage or surplus? What is the equilibrium price and quantity?
(Essay)
4.8/5 (35)
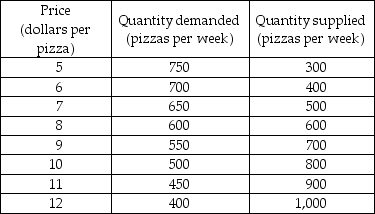 -A market research team has come up with the demand and supply schedules for pizza in Cheeseboro. These schedules are given in the table above. Use these data to analyze the situation in the market for pizza.
a) Draw a figure showing the demand curve for pizza and the supply curve of pizza. What are the equilibrium price and quantity?
b) Suppose the price is $10. Describe the situation in the market and explain how the price of pizza adjusts. Now suppose the price is $6. Describe the situation in the market and explain how the price of pizza adjusts.
c) The market research report also includes a prediction about the effect on the market for pizza in Cheeseboro of a recent news published in Cheeseboro Herald. The Herald reported that pizza has been discovered to help prevent heart diseases. Unfortunately, your dog chewed up the report and all you can read about the prediction is "quantity... by 150 at each price." What does the prediction say? Use your graph to show the predicted effects on the market for pizza. What are the predicted equilibrium price and quantity? How will the market adjust?
-A market research team has come up with the demand and supply schedules for pizza in Cheeseboro. These schedules are given in the table above. Use these data to analyze the situation in the market for pizza.
a) Draw a figure showing the demand curve for pizza and the supply curve of pizza. What are the equilibrium price and quantity?
b) Suppose the price is $10. Describe the situation in the market and explain how the price of pizza adjusts. Now suppose the price is $6. Describe the situation in the market and explain how the price of pizza adjusts.
c) The market research report also includes a prediction about the effect on the market for pizza in Cheeseboro of a recent news published in Cheeseboro Herald. The Herald reported that pizza has been discovered to help prevent heart diseases. Unfortunately, your dog chewed up the report and all you can read about the prediction is "quantity... by 150 at each price." What does the prediction say? Use your graph to show the predicted effects on the market for pizza. What are the predicted equilibrium price and quantity? How will the market adjust?
(Essay)
4.8/5 (39)
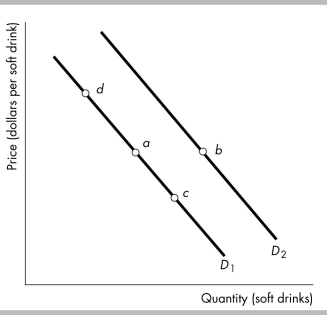 -Consider the demand curves for soft drinks shown in the figure above. A movement from point a to point c represents
(Multiple Choice)
4.9/5 (39)
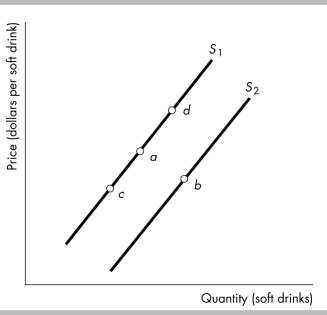 -The figure above shows supply curves for soft drinks. Suppose the economy is at point a. A movement to point d would be the result of
(Multiple Choice)
4.7/5 (34)
Sweatshirts and tee-shirts are complements in consumption and the price of a sweatshirt increases. As a result, the demand for
(Multiple Choice)
4.8/5 (39)
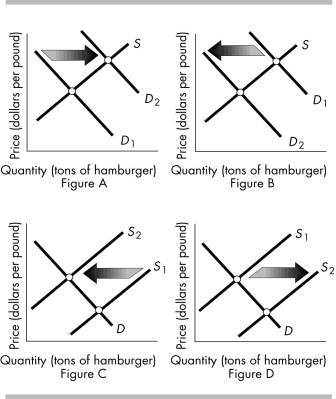 -The above figures show the market for hamburger meat. Which figure(s) shows the effect of an increase in the price of a substitute like hot dogs?
(Multiple Choice)
4.7/5 (36)
Which of the following shifts the demand curve for movie downloads rightward?
(Multiple Choice)
4.9/5 (41)
When demand increases, the equilibrium price ________ and the equilibrium quantity ________.
(Multiple Choice)
4.9/5 (35)
Filters
- Essay(0)
- Multiple Choice(0)
- Short Answer(0)
- True False(0)
- Matching(0)