Exam 10: Aggregate Supply and Aggregate Demand
Exam 1: What Is Economics483 Questions
Exam 2: The Economic Problem443 Questions
Exam 3: Demand and Supply515 Questions
Exam 4: Measuring Gdp and Economic Growth395 Questions
Exam 5: Monitoring Jobs and Inflation409 Questions
Exam 6: Economic Growth352 Questions
Exam 7: Finance, Saving, and Investment227 Questions
Exam 8: Money, the Price Level, and Inflation578 Questions
Exam 9: The Exchange Rate and the Balance of Payments489 Questions
Exam 10: Aggregate Supply and Aggregate Demand426 Questions
Exam 11: Expenditure Multipliers469 Questions
Exam 12: The Business Cycle, Inflation, and Deflation409 Questions
Exam 13: Fiscal Policy263 Questions
Exam 14: Monetary Policy229 Questions
Exam 15: International Trade Policy208 Questions
Select questions type
Suppose the price level rises and the money wage remains constant. This set of changes leads to
(Multiple Choice)
4.8/5  (35)
(35)
According to the intertemporal substitution effect, when the price level rises and other things remain the same
(Multiple Choice)
4.9/5 (42)
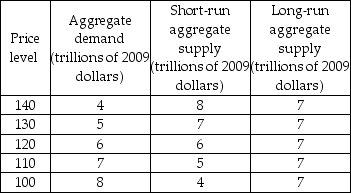 -The data in the above table show that when the price level is 120
(Multiple Choice)
4.8/5 (38)
There are several reasons why the aggregate demand curve is downward sloping. Which of the following CORRECTLY describes one of these explanations?
(Multiple Choice)
4.8/5 (37)
Fluctuations in aggregate demand and aggregate supply explain why real GDP fluctuates.
(True/False)
4.9/5 (44)
-The data in the above table show that when the price level is 120, if aggregate demand does not change then the
(Multiple Choice)
4.7/5 (29)
What is the difference between a recessionary gap and an inflationary gap?
(Essay)
4.7/5 (40)
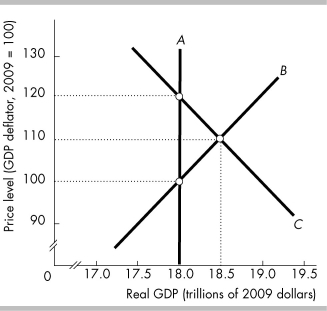 -In the above figure, curve A is the ________ curve, curve B is the ________ curve, and curve C is the ________ curve.
(Multiple Choice)
4.8/5 (45)
 -In the above figure, which part corresponds to a fall in the money wage rate?
(Multiple Choice)
4.7/5 (28)
In 2008, the dollar appreciated relative to the euro. This appreciation caused ________ and a ________.
(Multiple Choice)
4.8/5 (40)
Aggregate demand in India increased in 2008. In addition, real GDP grew strongly and inflation approached 10 percent. The best explanation for this inflation is that
(Multiple Choice)
4.8/5 (37)
The short-run aggregate supply curve shows a positive relationship between the price level and real GDP.
(True/False)
4.8/5 (29)
What are fiscal and monetary policies? Do they have an immediate effect on the AD curve or the SAS curve?
(Essay)
4.8/5 (40)
 -In the above figure, the economy is initially at point B. Then the price level falls by 10. The wealth effect will help
(Multiple Choice)
4.9/5 (35)
Filters
- Essay(0)
- Multiple Choice(0)
- Short Answer(0)
- True False(0)
- Matching(0)