Exam 10: Aggregate Supply and Aggregate Demand
Exam 1: What Is Economics483 Questions
Exam 2: The Economic Problem443 Questions
Exam 3: Demand and Supply515 Questions
Exam 4: Measuring Gdp and Economic Growth395 Questions
Exam 5: Monitoring Jobs and Inflation409 Questions
Exam 6: Economic Growth352 Questions
Exam 7: Finance, Saving, and Investment227 Questions
Exam 8: Money, the Price Level, and Inflation578 Questions
Exam 9: The Exchange Rate and the Balance of Payments489 Questions
Exam 10: Aggregate Supply and Aggregate Demand426 Questions
Exam 11: Expenditure Multipliers469 Questions
Exam 12: The Business Cycle, Inflation, and Deflation409 Questions
Exam 13: Fiscal Policy263 Questions
Exam 14: Monetary Policy229 Questions
Exam 15: International Trade Policy208 Questions
Select questions type
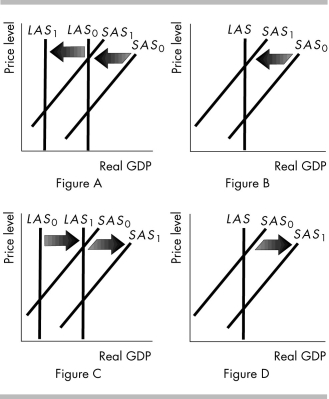
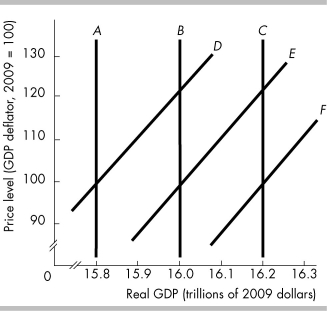 -In the above figure, B is the current long-run aggregate supply curve and E is the current short-run aggregate supply curve. If there is an increase in the full-employment quantity of labor, then the long-run aggregate supply curve and the short-run aggregate supply curve
(Multiple Choice)
4.8/5  (30)
(30)
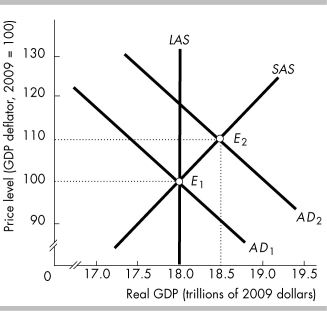 -The reason that it is possible for the economy in the above figure to be at equilibrium point E2 rather than at equilibrium point E1 is that
(Multiple Choice)
4.9/5 (48)
 -In the above figure, the economy will be at full employment if the price level
(Multiple Choice)
4.8/5 (43)
The quantity of real GDP demanded equals $18.4 trillion when the price level is 95. If the price level falls to 90, the quantity of real GDP demanded equals
(Multiple Choice)
4.9/5 (38)
In the short-run, real GDP can be greater than or less than potential GDP because in the short run the
(Multiple Choice)
4.9/5 (38)
Substitution effects help explain the slope of the aggregate demand curve. One substitution effect refers to the
(Multiple Choice)
5.0/5 (29)
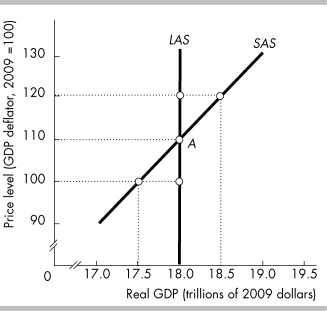
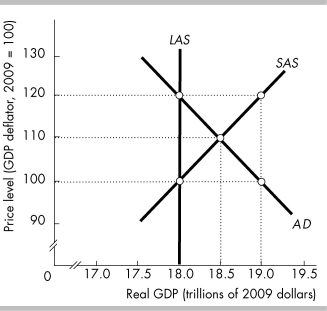
 -In the above figure, the short-run macroeconomic equilibrium is at the price level ________ and the real GDP level ________.
(Multiple Choice)
4.9/5 (39)
Long-run aggregate supply will decrease for all of the following reasons EXCEPT
(Multiple Choice)
4.7/5 (45)
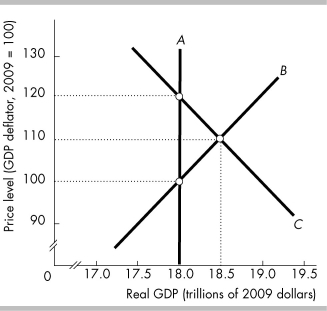
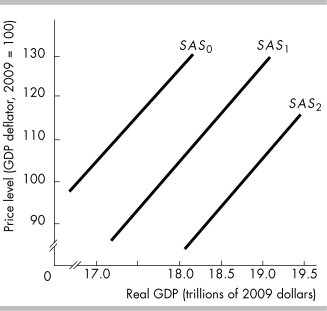 -In the above figure, the short-run aggregate supply curve is SAS1. If the prices of resources fall, there is
(Multiple Choice)
4.9/5 (34)
 -In the above figure, which point corresponds to an increase in human capital?
(Multiple Choice)
4.9/5 (43)
When the economy is at an above-full-employment equilibrium,
(Multiple Choice)
4.9/5 (43)
 -In the above figure, when the economy is in a long-run equilibrium, real GDP will be
(Multiple Choice)
4.7/5 (27)
Which of the following shifts the aggregate demand curve rightward?
(Multiple Choice)
4.9/5 (34)
Which of the following events shifts the aggregate demand curve leftward?
(Multiple Choice)
4.7/5 (39)
According to the intertemporal substitution effect, when the price level increases, the interest rate
(Multiple Choice)
4.8/5 (40)
Give examples of factors that decrease aggregate demand. Which way does the aggregate demand curve shift?
(Essay)
4.8/5 (33)
Filters
- Essay(0)
- Multiple Choice(0)
- Short Answer(0)
- True False(0)
- Matching(0)