Exam 10: Aggregate Supply and Aggregate Demand
Exam 1: What Is Economics483 Questions
Exam 2: The Economic Problem443 Questions
Exam 3: Demand and Supply515 Questions
Exam 4: Measuring Gdp and Economic Growth395 Questions
Exam 5: Monitoring Jobs and Inflation409 Questions
Exam 6: Economic Growth352 Questions
Exam 7: Finance, Saving, and Investment227 Questions
Exam 8: Money, the Price Level, and Inflation578 Questions
Exam 9: The Exchange Rate and the Balance of Payments489 Questions
Exam 10: Aggregate Supply and Aggregate Demand426 Questions
Exam 11: Expenditure Multipliers469 Questions
Exam 12: The Business Cycle, Inflation, and Deflation409 Questions
Exam 13: Fiscal Policy263 Questions
Exam 14: Monetary Policy229 Questions
Exam 15: International Trade Policy208 Questions
Select questions type
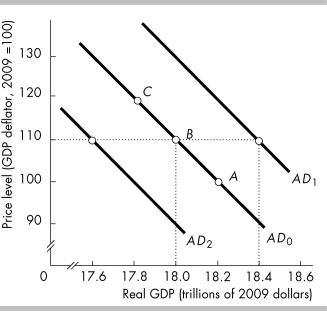
 -In the above figure, which movement illustrates the impact of a falling price level and a constant money wage rate?
(Multiple Choice)
4.8/5  (37)
(37)
 -In the above figure, the economy is initially at point B. If the exchange rate falls, there is
(Multiple Choice)
4.9/5 (42)
An individual holds $10,000 in a checking account and the price level rises significantly. Hence
(Multiple Choice)
4.9/5 (28)
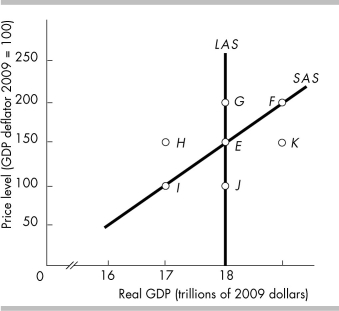
 -In the above figure, the economy is at point A and the money wage rate falls by 10 percent. If the price level is constant, firms will be willing to supply output equal to
(Multiple Choice)
4.8/5 (32)
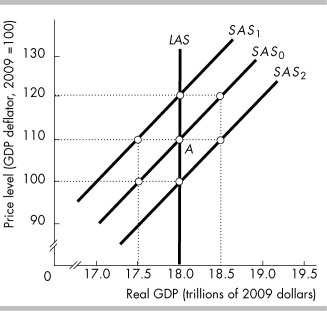
Suppose there is a temporary increase in the price of oil. This is represented by
(Multiple Choice)
4.8/5 (37)
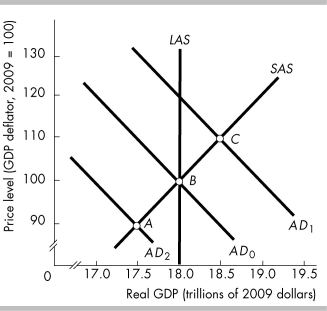 -Suppose the economy is at point B. If firms expect profits will be higher in the future, to what point might the economy move in the short run?
(Multiple Choice)
4.9/5 (42)
A recessionary gap means that the level of real GDP at the short-run macroeconomic equilibrium
(Multiple Choice)
4.9/5 (34)
In the short run, a decrease in government expenditure ________ real GDP and ________ the price level.
(Multiple Choice)
4.9/5 (31)
In the short run, an increase in government expenditure on goods and services ________ real GDP and ________ the price level.
(Multiple Choice)
4.7/5 (42)
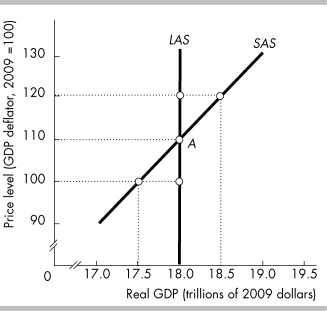 -In the figure above, the economy is at point A when the price level rises to 120. Money wage rates and other resource prices remain constant. Firms are willing to supply output equal to
(Multiple Choice)
4.9/5 (37)
If the aggregate demand curve shifts ________ faster than the long-run aggregate supply curve, then ________ occurs.
(Multiple Choice)
4.7/5 (30)
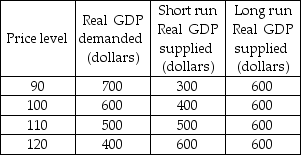 -The table above gives the aggregate demand and aggregate supply schedules in Lotus Land. Lotus Land is in short-run macroeconomic equilibrium. In the long run, if aggregate demand does not change, then Lotus Land will return to full employment as
(Multiple Choice)
4.8/5 (33)
Economic growth in India has averaged about 8.5 percent in recent years and while inflation averaged almost 9 percent. The AS-AD model shows this process as
(Multiple Choice)
4.8/5 (40)
________ economists believe that the economy is self-regulating and will be at full employment as long as monetary policy is not erratic.
(Multiple Choice)
4.8/5 (40)
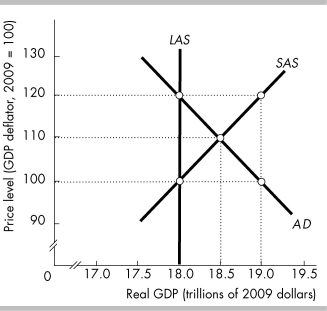 -In the above figure, as the economy adjusts toward equilibrium, the
(Multiple Choice)
4.9/5 (35)
Which of the following helps determine the growth rate of potential GDP?
I. capital accumulation
II. technology advances
III. growth in the quantity of money
(Multiple Choice)
4.9/5 (39)
We distinguish between the long-run aggregate supply curve and the short-run aggregate supply curve. In the long run
(Multiple Choice)
4.9/5 (31)
Filters
- Essay(0)
- Multiple Choice(0)
- Short Answer(0)
- True False(0)
- Matching(0)