Exam 11: Topics From Analytic Geometry
Exam 1: Fundamental Concepts of Algebra150 Questions
Exam 2: Equations and Inequalities142 Questions
Exam 3: Functions and Graphs147 Questions
Exam 4: Polynomial and Rational Functions147 Questions
Exam 5: Inverse, Exponential, and Logarithmic Functions144 Questions
Exam 6: The Trigonometric Functions150 Questions
Exam 7: Analytic Trigonometry150 Questions
Exam 8: Applications of Trigonometry144 Questions
Exam 9: Systems of Equations and Inequalities147 Questions
Exam 10: Sequences, Series and Probability150 Questions
Exam 11: Topics From Analytic Geometry150 Questions
Select questions type
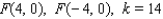
Find an equation for the set of points in an xy-plane such that the difference of the distances from F and F ' is k. 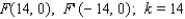
(Multiple Choice)
4.7/5  (33)
(33)
Lissajous figures are used in the study of electrical circuits to determine the phase difference  between a known voltage
 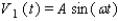 and an unknown voltage
 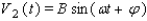 having the same frequency. The voltages are graphed parametrically as
  and
and  . If
. If  is acute, then
  where y int is the nonnegative y -intercept and y max is the maximum y -value on the curve. Graph the parametric curve and use the graph to approximate
  in degrees if
(Multiple Choice)
4.9/5 (36)
Lissajous figures are used in the study of electrical circuits to determine the phase difference  between a known voltage
  and an unknown voltage
  having the same frequency. The voltages are graphed parametrically as
  and
and  . If
. If  is acute, then
  where y int is the nonnegative y -intercept and y max is the maximum y-value on the curve. Graph the parametric curve and use the graph to approximate
  in degrees if
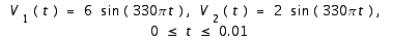
(Multiple Choice)
4.8/5 (35)
Find a polar equation in r and  that has the same graph as the equation in x and y.
(Multiple Choice)
4.8/5 (38)
Find a polar equation in r and  that has the same graph as the equation in x and y.
(Multiple Choice)
4.9/5 (36)
Find an equation for the parabola that has a horizontal axis and passes through the given points. 
(Multiple Choice)
4.9/5 (33)
Find an equation in x and y whose graph contains the points on the curve C. 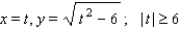
(Multiple Choice)
4.9/5 (40)
Find the vertices, the foci, and the equations of the asymptotes of the hyperbola. 
(Multiple Choice)
4.8/5 (35)
Find an equation for the parabola that has a horizontal axis and passes through the given points. 
(Multiple Choice)
4.9/5 (31)
Find the vertices, the foci, and the equations of the asymptotes of the hyperbola. 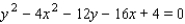
(Multiple Choice)
4.8/5 (38)
Find an equation for the set of points in an xy-plane such that the sum of the distances from  and
and  is
is  .
. 
(Multiple Choice)
4.9/5 (32)
Find an equation of the parabola that satisfies the condition. Vertex  , directrix
(Multiple Choice)
4.8/5 (37)
Find an equation for the set of points in an xy-plane that are equidistant from the point P and the line l. 
(Multiple Choice)
4.8/5 (33)
Filters
- Essay(0)
- Multiple Choice(0)
- Short Answer(0)
- True False(0)
- Matching(0)