Exam 11: Topics From Analytic Geometry
Exam 1: Fundamental Concepts of Algebra150 Questions
Exam 2: Equations and Inequalities142 Questions
Exam 3: Functions and Graphs147 Questions
Exam 4: Polynomial and Rational Functions147 Questions
Exam 5: Inverse, Exponential, and Logarithmic Functions144 Questions
Exam 6: The Trigonometric Functions150 Questions
Exam 7: Analytic Trigonometry150 Questions
Exam 8: Applications of Trigonometry144 Questions
Exam 9: Systems of Equations and Inequalities147 Questions
Exam 10: Sequences, Series and Probability150 Questions
Exam 11: Topics From Analytic Geometry150 Questions
Select questions type
Find a polar equation in r and  that has the same graph as the equation in x and y.
(Multiple Choice)
4.9/5  (42)
(42)
An arch of a bridge is semi-elliptical, with major axis horizontal. The base of the arch is 30 feet across, and the highest part of the arch is 10 feet above the horizontal roadway, as shown in the figure. Find the height of the arch 7 feet from the center of the base. 
(Multiple Choice)
4.8/5 (44)
Shown in the figure is the Lissajous figure given by 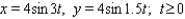 Find the period of the figure - that is, the length of the smallest t-interval that traces the curve.
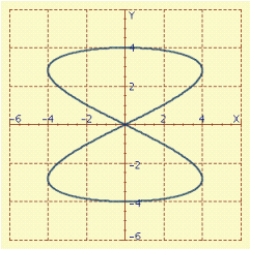
(Multiple Choice)
4.9/5 (47)
Find a polar equation of the conic with focus at the pole that has the eccentricity and equation of directrix. 

(Multiple Choice)
4.7/5 (34)
Find an equation for the set of points in an xy-plane such that the difference of the distances from F and F ' is k. 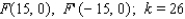
(Multiple Choice)
4.7/5 (41)
Lissajous figures are used in the study of electrical circuits to determine the phase difference  between a known voltage
  and an unknown voltage
  having the same frequency. The voltages are graphed parametrically as
  and
and  . If
. If  is acute, then
  where y int is the nonnegative y -intercept and y max is the maximum y -value on the curve. Graph the parametric curve and use the graph to approximate
  in degrees if
(Multiple Choice)
5.0/5 (40)
Find a polar equation in r and  that has the same graph as the equation in x and y.
(Multiple Choice)
4.8/5 (32)
Find an equation of the parabola that satisfies the condition. Vertex  , directrix
(Multiple Choice)
4.8/5 (27)
An arch of a bridge is semi-elliptical, with major axis horizontal. The base of the arch is 30 feet across, and the highest part of the arch is 10 feet above the horizontal roadway, as shown in the figure. Find the height of the arch 7 feet from the center of the base. 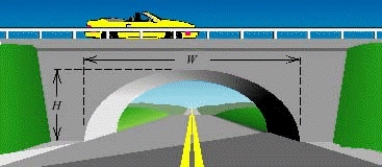
(Multiple Choice)
4.7/5 (41)
Polar equations of conics can be used to describe the motion of comets. These paths can be graphed using the following polar equation, where e is the eccentricity of the conic and r per is the perihelion distance measured in AU. The orbit of Saturn has r per = 9.006 and e = 0.056. The motion of Comet 1973.99 has r per = 0.142 and e = 2.718282. Graph both the motion of the comet and the orbit of Saturn. 
(Multiple Choice)
4.8/5 (42)
Find an equation for the ellipse that has its center at the origin and satisfies the conditions. 
(Multiple Choice)
4.8/5 (35)
The parametric equations specify the position of a moving point P ( x, y ) at time t. Sketch the graph. 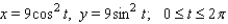
(Multiple Choice)
4.9/5 (39)
Find a polar equation in r and  of the parabola with focus at the pole and the given vertex.
(Multiple Choice)
4.9/5 (36)
Change the rectangular coordinates  to polar coordinates with
  and
and  .
.
(Multiple Choice)
4.9/5 (37)
Find an equation of the parabola that satisfies the condition. Vertex  , focus
(Multiple Choice)
4.9/5 (37)
The parametric equations specify the position of a moving point P ( x, y ) at time t. Sketch the graph. 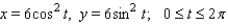
(Multiple Choice)
4.9/5 (35)
Filters
- Essay(0)
- Multiple Choice(0)
- Short Answer(0)
- True False(0)
- Matching(0)