Exam 11: Topics From Analytic Geometry
Exam 1: Fundamental Concepts of Algebra150 Questions
Exam 2: Equations and Inequalities142 Questions
Exam 3: Functions and Graphs147 Questions
Exam 4: Polynomial and Rational Functions147 Questions
Exam 5: Inverse, Exponential, and Logarithmic Functions144 Questions
Exam 6: The Trigonometric Functions150 Questions
Exam 7: Analytic Trigonometry150 Questions
Exam 8: Applications of Trigonometry144 Questions
Exam 9: Systems of Equations and Inequalities147 Questions
Exam 10: Sequences, Series and Probability150 Questions
Exam 11: Topics From Analytic Geometry150 Questions
Select questions type
Find an equation in x and y that has the same graph as the polar equation. 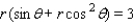
(Multiple Choice)
4.9/5  (32)
(32)
Polar equations of conics can be used to describe the motion of comets. These paths can be graphed using the following polar equation, where e is the eccentricity of the conic and r per is the perihelion distance measured in AU. For Encke's Comet r per = 0.3317 and e = 0.8499, determine whether its trajectory is elliptical, parabolic, or hyperbolic. 
(Multiple Choice)
4.9/5 (28)
Find a polar equation of the conic with focus at the pole that has the eccentricity and equation of directrix. 

(Multiple Choice)
4.8/5 (29)
Find the vertices, the foci, and the equations of the asymptotes of the hyperbola. 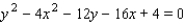
(Multiple Choice)
4.9/5 (32)
Find a polar equation of the conic with focus at the pole that has the eccentricity and equation of directrix. 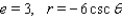
(Multiple Choice)
4.8/5 (42)
Find an equation for the ellipse that has its center at the origin and satisfies the conditions. 
(Multiple Choice)
4.8/5 (35)
Find a polar equation in r and  of the parabola with focus at the pole and the given vertex.
(Multiple Choice)
5.0/5 (27)
Shown in the figure is the Lissajous figure given by 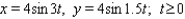 Find the period of the figure - that is, the length of the smallest t-interval that traces the curve.
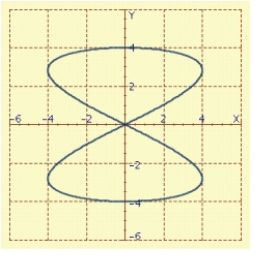
(Multiple Choice)
4.9/5 (30)
Lissajous figures are used in the study of electrical circuits to determine the phase difference  between a known voltage
 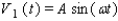 and an unknown voltage
 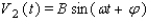 having the same frequency. The voltages are graphed parametrically as
  and
and  . If
. If  is acute, then
 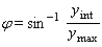 where y int is the nonnegative y -intercept and y max is the maximum y-value on the curve. Graph the parametric curve and use the graph to approximate
  in degrees if
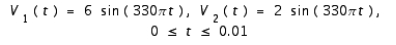
(Multiple Choice)
4.8/5 (33)
Filters
- Essay(0)
- Multiple Choice(0)
- Short Answer(0)
- True False(0)
- Matching(0)