Exam 21: An Introduction to Macroeconomics
Exam 1: What Is Economics254 Questions
Exam 2: The Economony: Myth and Reality184 Questions
Exam 3: The Fundamental Economic Problem: Scarcity and Choice278 Questions
Exam 4: Supply and Demand: an Initial Look297 Questions
Exam 5: Consumer Choice: Individual and Market Demand213 Questions
Exam 6: Demand and Elasticity247 Questions
Exam 7: Production, Inputs, and Cost: Building Blocks for Supply Analysis246 Questions
Exam 8: Output, Price, and Profit: the Importance of Marginal Analysis232 Questions
Exam 9: The Financial Markets and the Economy: the Tail That Wags the Dog225 Questions
Exam 10: The Firm and the Industry Under Perfect Competition219 Questions
Exam 11: The Case for Free Markets: the Price System251 Questions
Exam 12: Monopoly236 Questions
Exam 13: Between Competition and Monopoly248 Questions
Exam 14: Limiting Market Power: Antitrust and Regulation152 Questions
Exam 15: The Shortcomings of Free Markets210 Questions
Exam 16: The Economics of the Environment, and Natural Resources218 Questions
Exam 17: Taxation and Resource Allocation218 Questions
Exam 18: Pricing the Factors of Production230 Questions
Exam 19: Labor and Entrepreneurship: the Human Inputs267 Questions
Exam 20: Poverty, Inequality, and Discrimination167 Questions
Exam 21: An Introduction to Macroeconomics212 Questions
Exam 22: The Goals of Macroeconomic Policy212 Questions
Exam 23: Economic Growth: Theory and Policy226 Questions
Exam 24: Aggregate Demand and the Powerful Consumer216 Questions
Exam 25: Demand-Side Equilibrium: Unemployment or Inflation215 Questions
Exam 26: Bringing in the Supply Side: Unemployment and Inflation228 Questions
Exam 27: Managing Aggregate Demand: Fiscal Policy207 Questions
Exam 28: Money and the Banking System222 Questions
Exam 29: Monetary Policy: Conventional and Unconventional208 Questions
Exam 30: The Financial Crisis and the Great Recession64 Questions
Exam 31: The Debate Over Monetary and Fiscal Policy216 Questions
Exam 32: Budget Deficits in the Short and Long Run214 Questions
Exam 33: The Trade-Off Between Inflation and Unemployment218 Questions
Exam 34: International Trade and Comparative Advantage215 Questions
Exam 35: The International Monetary System: Order or Disorder216 Questions
Exam 36: Exchange Rates and the Macroeconomy215 Questions
Exam 37: Contemporary Issues in the Useconomy23 Questions
Select questions type
During the first year of the Obama administration in 2009, the American economy experienced
(Multiple Choice)
4.8/5  (26)
(26)
Why do price levels increase when government adopts fiscal or monetary policy to correct the economy when it faces a recession and high unemployment?
(Essay)
4.7/5 (35)
In the United States during the period from 1870 to 1940, the price level was most likely to
(Multiple Choice)
4.8/5 (32)
Figure 5-2
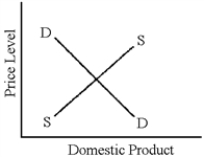 -In Figure 5-2, if the aggregate demand curve shifts outward over time, the economy will
(Multiple Choice)
4.9/5 (32)
In the past 100 years, the U.S.economy has primarily experienced
(Multiple Choice)
4.9/5 (50)
The Italian government collects a smaller amount of the taxes it is owed than the U.S.government.Other things being equal,
(Multiple Choice)
4.9/5 (31)
The end of the housing boom of the early 2000s can be illustrated by a decline in aggregate demand.
(True/False)
4.9/5 (38)
Macroeconomic models use abstract concepts such as "price level" and "national income" that are calculated by combining many markets into one.This process is known as
(Multiple Choice)
5.0/5 (35)
Stabilization policy has helped ameliorate the impact of recessions since the 1950s.
(True/False)
4.8/5 (39)
Aggregate demand and supply curves have been widely used to analyze the performance of the macroeconomy.Figure 5-3 shows four diagrams that represent different changes in the macroeconomy.Choose the diagram that best represents the situations described in the following questions.
Figure 5-3 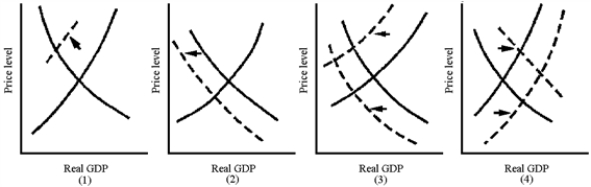 -Which graph in Figure 5-3 best represents the aggregate demand-induced Great Depression of the 1930s?
(Multiple Choice)
4.9/5 (33)
Stabilization policy often faces a trade-off between inflation and unemployment.
(True/False)
4.9/5 (46)
Which of the following transactions would be included in GDP for 2015?
(Multiple Choice)
4.8/5 (33)
The aggregate demand curve shows the quantity of domestic product
(Multiple Choice)
4.7/5 (36)
The key characteristic of macroeconomics is the process of aggregation.
(True/False)
4.8/5 (32)
John Maynard Keynes wrote that economies can suffer recession or depression for many years if the government does not intervene.
(True/False)
4.8/5 (39)
The main reason that President Clinton was forced to revise his campaign promise to cut taxes was that, in 1993, he faced a large
(Multiple Choice)
4.8/5 (32)
Filters
- Essay(0)
- Multiple Choice(0)
- Short Answer(0)
- True False(0)
- Matching(0)