Exam 11: Chi-Square Tests
Exam 1: Introduction118 Questions
Exam 2: Organizing and Visualizing Data210 Questions
Exam 3: Numerical Descriptive Measures143 Questions
Exam 4: Basic Probability171 Questions
Exam 5: Discrete Probability Distributions137 Questions
Exam 6: The Normal Distribution145 Questions
Exam 7: Sampling and Sampling Distributions197 Questions
Exam 8: Confidence Interval Estimation185 Questions
Exam 9: Fundamentals of Hypothesis Testing: One-Sample Tests168 Questions
Exam 10: Two-Sample Tests and One-Way ANOVA293 Questions
Exam 11: Chi-Square Tests108 Questions
Exam 12: Simple Linear Regression213 Questions
Exam 13: Introduction to Multiple Regression291 Questions
Exam 14: Statistical Applications in Quality Management107 Questions
Select questions type
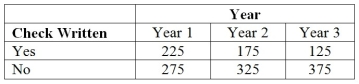
TABLE 11-6
According to an article in Marketing News, fewer checks are being written at the grocery store checkout than in the past. To determine whether there is a difference in the proportion of shoppers who pay by check among three consecutive years at a 0.05 level of significance, the results of a survey of 500 shoppers in three consecutive years are obtained and presented below.
 -Referring to Table 11-6, what is the value of the test statistic?
Free
(Short Answer)
4.7/5  (32)
(32)
Correct Answer: Verified
43.96
TABLE 11-7
Data on the percentage of 200 hotels in each of the three large cities across the world on whether minibar charges are correctly posted at checkout are given below.
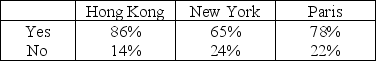 At the 0.05 level of significance, you want to know if there is evidence of a difference in the proportion of hotels that correctly post minibar charges among the three cities.
-Referring to Table 11-7, the value of the test statistic is ________.
At the 0.05 level of significance, you want to know if there is evidence of a difference in the proportion of hotels that correctly post minibar charges among the three cities.
-Referring to Table 11-7, the value of the test statistic is ________.
Free
(Short Answer)
4.8/5 (31)
Correct Answer:Verified
7.00
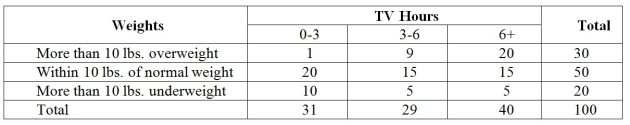
TABLE 11-13
Recent studies have found that American children are more obese than in the past. The amount of time children spent watching television has received much of the blame. A survey of 100 ten-year-olds revealed the following with regard to weights and average number of hours a day spent watching television. We are interested in testing whether the mean number of hours spent watching TV and weights are independent at 1% level of significance.
 -Referring to Table 11-13, suppose the value of the test statistic was 30.00 (which is not the correct value)and the critical value at 1% level of significance was 10.00 (which is not the correct value). Which of the following conclusions would be correct?
Free
(Multiple Choice)
4.8/5 (28)
Correct Answer:Verified
D
TABLE 11-1
A corporation randomly selects 150 salespeople and finds that 66% who have never taken a self-improvement course would like such a course. The firm did a similar study 10 years ago in which 60% of a random sample of 160 salespeople wanted a self-improvement course. The groups are assumed to be independent random samples. Let π1 and π2 represent the true proportion of workers who would like to attend a self-improvement course in the recent study and the past study, respectively.
-Referring to Table 11-1, what is the critical value when performing a chi-square test on whether the population proportions are different if α = 0.05?
(Multiple Choice)
4.8/5 (29)
TABLE 11-12
Parents complain that children read too few storybooks and watch too much television nowadays. A survey of 1,000 children reveals the following information on average time spent watching TV and average time spent reading storybooks.
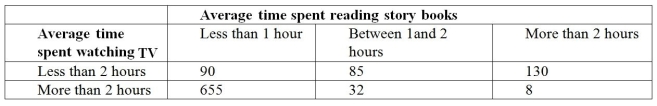 -Referring to Table 11-12, suppose we want to constrain the probability of committing a Type I error to 5% when testing whether there is any relationship between average time spent watching TV and average time spent reading story books. The critical value will be ________.
(Multiple Choice)
5.0/5 (37)
TABLE 11-4
A computer used by a 24-hour banking service is supposed to randomly assign each transaction to one of 5 memory locations. A check at the end of a day's transactions gave the counts shown in the table to each of the 5 memory locations, along with the number of reported errors.
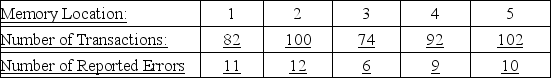 The bank manager wanted to test whether the proportion of errors in transactions assigned to each of the 5 memory locations differ.
-Referring to Table 11-4, the degrees of freedom of the test statistic is ________.
The bank manager wanted to test whether the proportion of errors in transactions assigned to each of the 5 memory locations differ.
-Referring to Table 11-4, the degrees of freedom of the test statistic is ________.
(Multiple Choice)
4.7/5 (27)
TABLE 11-12
Parents complain that children read too few storybooks and watch too much television nowadays. A survey of 1,000 children reveals the following information on average time spent watching TV and average time spent reading storybooks.
-Referring to Table 11-12, if the null hypothesis of no connection between time spent watching TV and time spent reading story books is true, how many children watching less than 2 hours of TV and reading no more than 2 hours of story books on average can we expect?
(Multiple Choice)
4.8/5 (35)
TABLE 11-11
The director of admissions at a state college is interested in seeing if admissions status (admitted, waiting list, denied admission) at his college is independent of the type of community in which an applicant resides. He takes a sample of recent admissions decisions and forms the following table:
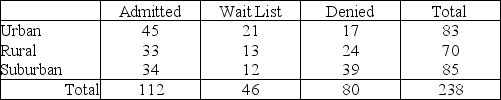 He will use this table to do a chi-square test of independence with a level of significance of 0.01.
-Referring to Table 11-11, the same decision would be made with this test if the level of significance had been 0.005.
He will use this table to do a chi-square test of independence with a level of significance of 0.01.
-Referring to Table 11-11, the same decision would be made with this test if the level of significance had been 0.005.
(True/False)
4.7/5 (30)
TABLE 11-8
A study published in the American Journal of Public Health was conducted to determine whether the use of seat belts in motor vehicles in San Diego County depends on ethnic status. A sample of 792 children treated for injuries sustained from motor vehicle accidents was obtained, and each child was classified according to (1) ethnic status (Hispanic or non-Hispanic) and (2) seat belt usage (worn or not worn) during the accident. The number of children in each category is given in the table below.
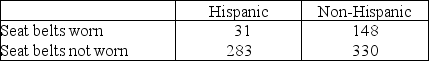 -Referring to Table 11-8, at 5% level of significance, the critical value of the test statistic is ________.
(Multiple Choice)
5.0/5 (23)
TABLE 11-5
Four surgical procedures currently are used to install pacemakers. If the patient does not need to return for follow-up surgery, the operation is called a "clear" operation. A heart center wants to compare the proportion of clear operations for the four procedures, and collects the following numbers of patients from their own records:
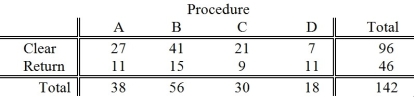 They will use this information to test for a difference among the proportion of clear operations using a chi-square test with a level of significance of 0.05.
-Referring to Table 11-5, the null hypothesis will be rejected.
They will use this information to test for a difference among the proportion of clear operations using a chi-square test with a level of significance of 0.05.
-Referring to Table 11-5, the null hypothesis will be rejected.
(True/False)
5.0/5 (40)
TABLE 11-10
One criterion used to evaluate employees in the assembly section of a large factory is the number of defective pieces per 1,000 parts produced. The quality control department wants to find out whether there is a relationship between years of experience and defect rate. Since the job is repetitious, after the initial training period, any improvement due to a learning effect might be offset by a loss of motivation. A defect rate is calculated for each worker in a yearly evaluation. The results for 100 workers are given in the table below.
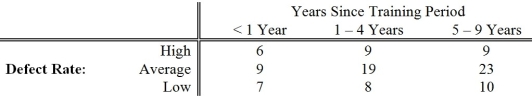 -Referring to Table 11-10, a test was conducted to determine if a relationship exists between defect rate and years of experience. Which of the following p-values would indicate that defect rate and years of experience are dependent? Assume you are testing at α = 0.05.
(Multiple Choice)
4.9/5 (32)
TABLE 11-6
According to an article in Marketing News, fewer checks are being written at the grocery store checkout than in the past. To determine whether there is a difference in the proportion of shoppers who pay by check among three consecutive years at a 0.05 level of significance, the results of a survey of 500 shoppers in three consecutive years are obtained and presented below.
-Referring to Table 11-6, what is the critical value?
(Short Answer)
4.8/5 (27)
TABLE 11-13
Recent studies have found that American children are more obese than in the past. The amount of time children spent watching television has received much of the blame. A survey of 100 ten-year-olds revealed the following with regard to weights and average number of hours a day spent watching television. We are interested in testing whether the mean number of hours spent watching TV and weights are independent at 1% level of significance.
-Referring to Table 11-13, the critical value of the test will be ________.
(Multiple Choice)
5.0/5 (37)
TABLE 11-1
A corporation randomly selects 150 salespeople and finds that 66% who have never taken a self-improvement course would like such a course. The firm did a similar study 10 years ago in which 60% of a random sample of 160 salespeople wanted a self-improvement course. The groups are assumed to be independent random samples. Let π1 and π2 represent the true proportion of workers who would like to attend a self-improvement course in the recent study and the past study, respectively.
-Referring to Table 11-1, what is the value of the test statistic to use in evaluating the alternative hypothesis that there is a difference in the two population proportions using α = 0.10?
(Multiple Choice)
4.8/5 (41)
TABLE 11-9
Many companies use well-known celebrities as spokespersons in their TV advertisements. A study was conducted to determine whether brand awareness of female TV viewers and the gender of the spokesperson are independent. Each in a sample of 300 female TV viewers was asked to identify a product advertised by a celebrity spokesperson. The gender of the spokesperson and whether or not the viewer could identify the product was recorded. The numbers in each category are given below.
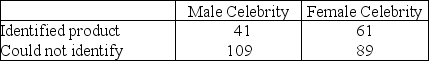 -Referring to Table 11-9, the degrees of freedom of the test statistic are ________.
(Multiple Choice)
4.8/5 (31)
TABLE 11-7
Data on the percentage of 200 hotels in each of the three large cities across the world on whether minibar charges are correctly posted at checkout are given below.
At the 0.05 level of significance, you want to know if there is evidence of a difference in the proportion of hotels that correctly post minibar charges among the three cities.
-Referring to Table 11-7, the expected cell frequency for the Hong Kong/Yes cell is ________.
(Short Answer)
5.0/5 (37)
TABLE 11-7
Data on the percentage of 200 hotels in each of the three large cities across the world on whether minibar charges are correctly posted at checkout are given below.
At the 0.05 level of significance, you want to know if there is evidence of a difference in the proportion of hotels that correctly post minibar charges among the three cities.
-When testing for independence in a contingency table with 3 rows and 4 columns, there are ________ degrees of freedom.
(Multiple Choice)
4.8/5 (27)
TABLE 11-3
The director of transportation of a large company is interested in the usage of her van pool. She considers her routes to be divided into local and non-local. She is particularly interested in learning if there is a difference in the proportion of males and females who use the local routes. She takes a sample of a day's riders and finds the following:
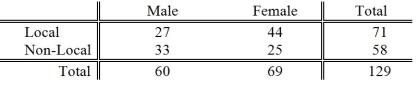 She will use this information to perform a chi-square hypothesis test using a level of significance of 0.05.
-Referring to Table 11-3, the expected cell frequency in the Female/Non-Local cell is ________.
She will use this information to perform a chi-square hypothesis test using a level of significance of 0.05.
-Referring to Table 11-3, the expected cell frequency in the Female/Non-Local cell is ________.
(Short Answer)
4.9/5 (30)
TABLE 11-5
Four surgical procedures currently are used to install pacemakers. If the patient does not need to return for follow-up surgery, the operation is called a "clear" operation. A heart center wants to compare the proportion of clear operations for the four procedures, and collects the following numbers of patients from their own records:
They will use this information to test for a difference among the proportion of clear operations using a chi-square test with a level of significance of 0.05.
-Referring to Table 11-5, the expected cell frequency for the Procedure D/Return cell is ________.
(Short Answer)
4.8/5 (42)
If we use the χ² analysis to test for the differences among 4 proportions, the degrees of freedom are equal to ________.
(Multiple Choice)
4.9/5 (44)
Filters
- Essay(0)
- Multiple Choice(0)
- Short Answer(0)
- True False(0)
- Matching(0)