Exam 2: Organizing and Visualizing Data
Exam 1: Introduction118 Questions
Exam 2: Organizing and Visualizing Data210 Questions
Exam 3: Numerical Descriptive Measures143 Questions
Exam 4: Basic Probability171 Questions
Exam 5: Discrete Probability Distributions137 Questions
Exam 6: The Normal Distribution145 Questions
Exam 7: Sampling and Sampling Distributions197 Questions
Exam 8: Confidence Interval Estimation185 Questions
Exam 9: Fundamentals of Hypothesis Testing: One-Sample Tests168 Questions
Exam 10: Two-Sample Tests and One-Way ANOVA293 Questions
Exam 11: Chi-Square Tests108 Questions
Exam 12: Simple Linear Regression213 Questions
Exam 13: Introduction to Multiple Regression291 Questions
Exam 14: Statistical Applications in Quality Management107 Questions
Select questions type
TABLE 2-10
The histogram below represents scores achieved by 200 job applicants on a personality profile.
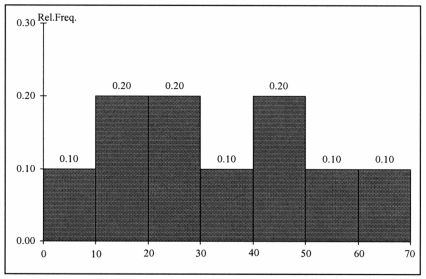 -Referring to the histogram from Table 2-10, 90% of the job applicants scored above or equal to ________.
Free
(Short Answer)
4.8/5  (25)
(25)
Correct Answer: Verified
10
TABLE 2-7
The stem-and-leaf display below contains data on the number of months between the date a civil suit is filed and when the case is actually adjudicated for 50 cases heard in superior court.
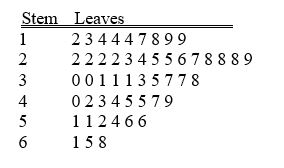 -Referring to Table 2-7, if a frequency distribution with equal sized classes was made from this data, and the first class was "10 but less than 20," the relative frequency of the third class would be ________.
Free
(Short Answer)
4.8/5 (36)
Correct Answer:Verified
0.20 or 20% or 10/50
When polygons or histograms are constructed, which axis must show the true zero or "origin"?
Free
(Multiple Choice)
4.8/5 (34)
Correct Answer:Verified
B
TABLE 2-5
The following are the duration in minutes of a sample of long-distance phone calls made within the continental United States reported by one long-distance carrier.
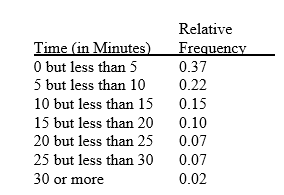 -Referring to Table 2-5, what is the cumulative relative frequency for the percentage of calls that lasted under 20 minutes?
(Multiple Choice)
4.9/5 (44)
TABLE 2-18
The stem-and-leaf display below shows the result of a survey on 50 students on their satisfaction with their school with the higher scores represent higher level of satisfaction.
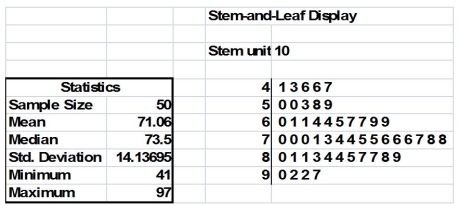 -Referring to Table 2-18, if a student is randomly selected, his/her most likely level of satisfaction among the 40s, 50s, 60s, 70s, 80s and 90s will be in the 60s.
(True/False)
4.8/5 (32)
TABLE 2-10
The histogram below represents scores achieved by 200 job applicants on a personality profile.
-Referring to the histogram from Table 2-10, ________ percent of the job applicants scored below 50.
(Short Answer)
4.9/5 (29)
TABLE 2-14
The table below contains the number of people who own a portable DVD player in a sample of 600 broken down by gender.
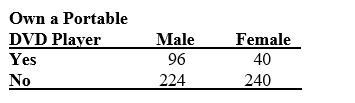 -Referring to Table 2-14, ________ percent of the 600 were males who owned a portable DVD.
(Short Answer)
4.9/5 (35)
TABLE 2-14
The table below contains the number of people who own a portable DVD player in a sample of 600 broken down by gender.
-Referring to Table 2-14, ________ percent of the 600 were males who did not own a portable DVD.
(Short Answer)
4.8/5 (26)
TABLE 2-12
The table below contains the opinions of a sample of 200 people broken down by gender about the latest congressional plan to eliminate anti-trust exemptions for professional baseball.
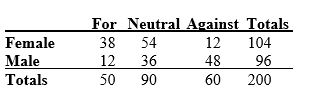 -Referring to Table 2-12, of the males in the sample, ________ percent were for the plan.
(Short Answer)
4.9/5 (34)
TABLE 2-12
The table below contains the opinions of a sample of 200 people broken down by gender about the latest congressional plan to eliminate anti-trust exemptions for professional baseball.
-Referring to Table 2-12, of the females in the sample, ________ percent were either neutral or against the plan.
(Short Answer)
4.9/5 (38)
TABLE 2-18
The stem-and-leaf display below shows the result of a survey on 50 students on their satisfaction with their school with the higher scores represent higher level of satisfaction.
-Referring to Table 2-18, if a student is randomly selected, his/her most likely level of satisfaction among the 40s, 50s, 60s, 70s, 80s and 90s will be in the 70s.
(True/False)
4.8/5 (25)
TABLE 2-15
The figure below is the ogive for the amount of fat (in grams) for a sample of 36 pizza products where the upper boundaries of the intervals are: 5, 10, 15, 20, 25, and 30.
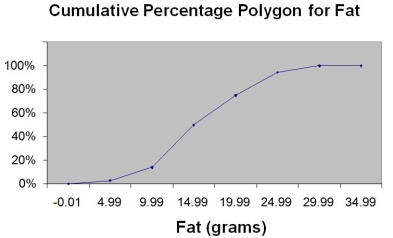 -Referring to Table 2-15, what percentage of pizza products contain between 10 and 25 grams of fat?
(Multiple Choice)
4.8/5 (32)
TABLE 2-14
The table below contains the number of people who own a portable DVD player in a sample of 600 broken down by gender.
-Referring to Table 2-14 of the females in the sample, ________ percent owned a portable DVD.
(Short Answer)
4.9/5 (45)
Data on the number of credit hours of 20,000 students at a public university enrolled in a spring semester were collected. Which of the following is the best for presenting the information?
(Multiple Choice)
4.8/5 (38)
TABLE 2-10
The histogram below represents scores achieved by 200 job applicants on a personality profile.
-Referring to the histogram from Table 2-10, ________ percent of the applicants scored below 20 or at least 50.
(Short Answer)
4.9/5 (31)
TABLE 2-15
The figure below is the ogive for the amount of fat (in grams) for a sample of 36 pizza products where the upper boundaries of the intervals are: 5, 10, 15, 20, 25, and 30.
-Referring to Table 2-15, what percentage of pizza products contain at least 20 grams of fat?
(Multiple Choice)
4.9/5 (38)
TABLE 2-12
The table below contains the opinions of a sample of 200 people broken down by gender about the latest congressional plan to eliminate anti-trust exemptions for professional baseball.
-Referring to Table 2-12, of the females in the sample, ________ percent were against the plan.
(Short Answer)
4.7/5 (32)
Filters
- Essay(0)
- Multiple Choice(0)
- Short Answer(0)
- True False(0)
- Matching(0)