Exam 7: Hypothesis Testing With One Sample
Exam 1: Introduction to Statistics74 Questions
Exam 2: Descriptive Statistics165 Questions
Exam 3: Probability125 Questions
Exam 4: Discrete Probability Distributions103 Questions
Exam 5: Normal Probability Distributions158 Questions
Exam 6: Confidence Intervals97 Questions
Exam 7: Hypothesis Testing With One Sample159 Questions
Exam 8: Hypothesis Testing With Two Samples122 Questions
Exam 9: Correlation and Regression118 Questions
Exam 10: Chi-Square Tests and the F-Distribution91 Questions
Exam 11: Nonparametric Tests Online and CD Only81 Questions
Select questions type
A candidate for governor of a certain state claims to be favored by at least half of the voters. If a hypothesis test is performed, how should you interpret a decision that rejects the null hypothesis?
(Multiple Choice)
4.8/5  (45)
(45)
The mean age of bus drivers in Chicago is 56.9 years. State this claim mathematically. Write the null and
alternative hypotheses. Identify which hypothesis is the claim.
(Short Answer)
4.7/5 (24)
A telephone company claims that 20% of its customers have at least two telephone lines. The company selects
a random sample of 500 customers and finds that 88 have two or more telephone lines. If α = 0.05, test the
companyʹs claim using confidence intervals.
(Essay)
4.8/5 (36)
Determine the critical value, z0, to test the claim about the population proportion .325 given n = 42
(Multiple Choice)
4.7/5 (40)
Test the claim about the population mean at the level of significance α Assume the population is normally
distributed.
(Essay)
4.8/5 (38)
Find the P-value for the hypothesis test with the standardized test statistic z. Decide whether to reject for the level of significance α Left-tailed test
Z = -1.83 α = 0.05
(Multiple Choice)
4.8/5 (40)
A candidate for governor of a particular state claims to be favored by at least half of the voters. State this claim
mathematically. Write the null and alternative hypotheses. Identify which hypothesis is the claim.
(Short Answer)
4.8/5 (36)
The alternative hypothesis is given with its graph. State the null hypothesis and sketch its graph. 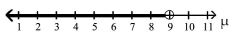
(Multiple Choice)
4.8/5 (37)
Compute the standardized test statistic, to test the claim
(Multiple Choice)
4.7/5 (36)
Test the claim that 40, given that and the sample statistics are n =
(Essay)
4.8/5 (33)
A recent study claimed that at least 15% of junior high students are overweight. In a sample of 160 students, 18
were found to be overweight. If α = 0.05, test the claim using confidence intervals.
(Essay)
4.9/5 (34)
Find the standardized test statistic t for a sample with your answer to three decimal places.
(Multiple Choice)
4.8/5 (36)
The engineering school at a major university claims that 20% of its graduates are women. In a graduating class
of 210 students, 58 were women. Does this suggest that the school is believable? Use = 0.05.
(Essay)
4.7/5 (40)
A candidate for governor of a certain state claims to be favored by at least half of the voters. If a hypothesis test is performed, how should you interpret a decision that fails to reject the null hypothesis?
(Multiple Choice)
4.7/5 (29)
The mean score for all NBA games during a particular season was less than 90 points per game. Identify the
type I and type II errors for the hypothesis test of this claim.
(Essay)
4.7/5 (32)
A coin is tossed 1000 times and 530 heads appear. At α = 0.05, test the claim that this is not a biased coin. Use a
P-value. Does this suggest the coin is fair?
(Essay)
4.8/5 (34)
Find the standardized test statistic t for a sample with Round your answer to three decimal places.
(Multiple Choice)
4.9/5 (34)
Suppose you want to test the claim that Given a sample size of n = 55 and a level of significance of α = 0.01, when should you reject H₀?
(Multiple Choice)
4.9/5 (35)
A fast food outlet claims that the mean waiting time in line is less than 3.8 minutes. A random sample of 60
customers has a mean of 3.7 minutes with a population standard deviation of 0.6 minute. If α = 0.05, test the
fast food outletʹs claim.
(Essay)
4.8/5 (41)
Test the claim that .10. Assume that the population is normally distributed.
(Essay)
4.8/5 (23)
Filters
- Essay(0)
- Multiple Choice(0)
- Short Answer(0)
- True False(0)
- Matching(0)