Exam 3: Data Description
Exam 1: The Nature of Probability and Statistics53 Questions
Exam 2: Frequency Distributions and Graphs79 Questions
Exam 3: Data Description98 Questions
Exam 5: Discrete Probability Distributions75 Questions
Exam 6: The Normal Distribution81 Questions
Exam 7: Confidence Intervals and Sample Size74 Questions
Exam 8: Hypothesis Testing86 Questions
Exam 9: Testing the Difference Between Two Means, Two Variances, and Two Proportions73 Questions
Exam 10: Correlation and Regression78 Questions
Exam 11: Other Chi-Square Tests69 Questions
Exam 12: Analysis of Variance71 Questions
Exam 13: Nonparametric Statistics87 Questions
Exam 14: Sampling and Simulation67 Questions
Select questions type
Using the following frequency distribution, find the mean. 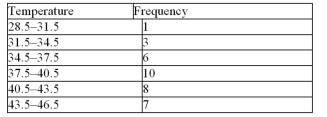
Free
(Multiple Choice)
4.7/5  (35)
(35)
Correct Answer: Verified
B
To find the mean for grouped data, we take the sum of all the frequencies, multiply this by the midpoint
of each class and then divide boor the sample size.
Free
(True/False)
4.8/5 (30)
Correct Answer:Verified
False
What is the mean of the following numbers? 4, 6, 9, 11, 15
Free
(Multiple Choice)
4.7/5 (42)
Correct Answer:Verified
C
Which of the following is the correct mean for the given data? 7, 8, 13, 9, 10, 11
(Multiple Choice)
4.9/5 (29)
What is the midrange of the following numbers? 5, 11, 10, 12, 4, 12, 18, 18, 18
(Multiple Choice)
4.9/5 (37)
The range of a data set is the distance between the highest value and the lowest value.
(True/False)
4.7/5 (43)
If the value 5 has z-score of -0.75 in a dataset, then the mean of that dataset is
(Multiple Choice)
4.7/5 (36)
Given the following data set, find the IQR.
28, 11, 22, 14, 8, 15, 25
(Short Answer)
4.9/5 (37)
A student scored 75 points on a test where the mean score was 81 and the standard deviation was 6.The student's z-score was
(Multiple Choice)
4.8/5 (39)
The ________________ is the mode for grouped data.
________________________________________
(Short Answer)
4.9/5 (30)
Chebyshev's theorem can be used to find the minimum percentage of data values that will fall between
any two given values.
(True/False)
4.9/5 (33)
Determine the range for this data: 4, 7, 3, 16, 5, 22, and 8:
(Multiple Choice)
4.8/5 (35)
A student scored 89 points on a test where the mean score was 83 and the standard deviation was 3.The student's z-score was
(Multiple Choice)
4.9/5 (39)
A five-number summary of a data set consists of the minimum,  , the mean,
  , and the
maximum.
, and the
maximum.
(True/False)
4.7/5 (37)
_______________ applies to any distribution regardless of its shape.
________________________________________
(Short Answer)
4.8/5 (46)
Filters
- Essay(0)
- Multiple Choice(0)
- Short Answer(0)
- True False(0)
- Matching(0)