Exam 2: Frequency Distributions and Graphs
Exam 1: The Nature of Probability and Statistics53 Questions
Exam 2: Frequency Distributions and Graphs79 Questions
Exam 3: Data Description98 Questions
Exam 5: Discrete Probability Distributions75 Questions
Exam 6: The Normal Distribution81 Questions
Exam 7: Confidence Intervals and Sample Size74 Questions
Exam 8: Hypothesis Testing86 Questions
Exam 9: Testing the Difference Between Two Means, Two Variances, and Two Proportions73 Questions
Exam 10: Correlation and Regression78 Questions
Exam 11: Other Chi-Square Tests69 Questions
Exam 12: Analysis of Variance71 Questions
Exam 13: Nonparametric Statistics87 Questions
Exam 14: Sampling and Simulation67 Questions
Select questions type
For the table below, calculate the percent of students that fell within the B class. 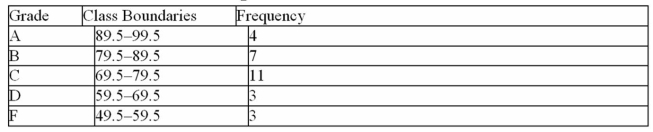
Free
(Multiple Choice)
4.9/5  (38)
(38)
Correct Answer: Verified
B
The three most commonly used graphs in research are the histogram, the __________, and the cumulative
frequency graph (ogive).
________________________________________
Free
(Short Answer)
4.9/5 (43)
Correct Answer:Verified
frequency polygon
For the class 16.3-23.8, the width is 7.
Free
(True/False)
4.9/5 (37)
Correct Answer:Verified
False
Graphs give a visual representation that enables readers to analyze and interpret data more easily than
they could simply by looking at numbers.
(True/False)
4.9/5 (31)
Karen is constructing a pie graph to represent the number of hours her classmates do homework each day. She found that 8/24 did homework for three hours each day.In her pie graph, this would represent how
Many degrees?
(Multiple Choice)
4.9/5 (34)
The total frequency of the data whose histogram is shown below is approximately
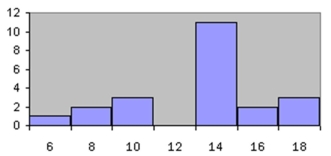
(Multiple Choice)
4.7/5 (37)
What would be the boundaries on the average age for high school graduates if they were reported to be 18 years old?
(Multiple Choice)
4.7/5 (49)
When the range is large and classes that are several units in width are needed, a __________ frequency
distribution is used.
________________________________________
(Short Answer)
4.7/5 (31)
Thirty students recorded the colours of their eyes, choosing from the colours brown, blue, green, hazel, and black.This data can be appropriately summarized in a
(Multiple Choice)
4.9/5 (37)
A time series graph represents data that occur over a specific period.
(True/False)
4.9/5 (37)
A weatherman records the amount of rain that has fallen in Vancouver, B.C. during each day.What type of graph should he use?
(Multiple Choice)
4.8/5 (35)
Greg wants to construct a frequency distribution for the political affiliation of the employees at Owen's Hardware Store.What type of distribution should he use?
(Multiple Choice)
4.8/5 (34)
A local fundraiser wants to graphically display the contributions they have
received over the past five years.Construct a time series graph for the following
data. 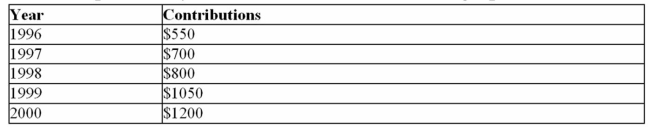
(Essay)
4.8/5 (43)
The __________ is the number of values in a specific class of a frequency distribution.
________________________________________
(Short Answer)
4.8/5 (42)
Filters
- Essay(0)
- Multiple Choice(0)
- Short Answer(0)
- True False(0)
- Matching(0)