Exam 11: Graphing Utilities
Exam 1: Equations and Inequalities365 Questions
Exam 2: Graphs83 Questions
Exam 3: Functions and Their Graphs112 Questions
Exam 4: Linear and Quadratic Functions21 Questions
Exam 5: Polynomial and Rational Functions45 Questions
Exam 6: Exponential and Logarithmic Functions234 Questions
Exam 7: Analytic Geometry129 Questions
Exam 8: Systems of Equations and Inequalities428 Questions
Exam 9: Sequences; Induction; the Binomial Theorem242 Questions
Exam 10: Counting and Probability110 Questions
Exam 11: Graphing Utilities25 Questions
Select questions type
Graph the equation using the indicated viewing window.
-y = x + 4;X min = -5X max = 5X scl = 1Y min = -4Y max = 4Y scl = 1
(Multiple Choice)
4.9/5  (33)
(33)
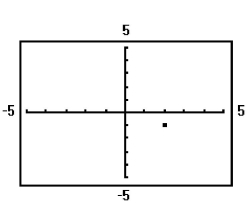
Determine the coordinates of the points shown. Tell in which quadrant the point lies. Assume the coordinates are
integers.
-
(Multiple Choice)
4.8/5 (31)
For the equation, create a table,  and list points on the graph.
-2x + 3y = 6
and list points on the graph.
-2x + 3y = 6
(Multiple Choice)
4.9/5 (31)
Filters
- Essay(0)
- Multiple Choice(0)
- Short Answer(0)
- True False(0)
- Matching(0)