Exam 4: Market Failures Caused by Externalities Asymmetric Information
Exam 1: Limits, Alternatives, and Choices107 Questions
Exam 2: The Market System and the Circular Flow287 Questions
Exam 3: Demand, Supply, and Market Equilibrium151 Questions
Exam 4: Market Failures Caused by Externalities Asymmetric Information229 Questions
Exam 5: Public Goods, Public Choice, and Government Failure268 Questions
Exam 6: Elasticity399 Questions
Exam 7: Utility Maximization358 Questions
Exam 8: Behavioral Economics311 Questions
Exam 9: Businesses and the Costs of Production445 Questions
Exam 10: Pure Competition in the Short Run342 Questions
Exam 11: Pure Competition in the Long Run250 Questions
Exam 12: Pure Monopoly407 Questions
Exam 13: Monopolistic Competition279 Questions
Exam 14: Oligopoly and Strategic Behavior362 Questions
Exam 15: Technology, RD, and Efficiency309 Questions
Exam 16: The Demand for Resources359 Questions
Exam 17: Wage Determination168 Questions
Exam 18: Rent, Interest, and Profit305 Questions
Exam 19: Natural Resource and Energy Economics337 Questions
Exam 20: Public Finance: Expenditures and Taxes336 Questions
Exam 21: Antitrust Policy and Regulation264 Questions
Exam 22: Agriculture: Economics and Policy265 Questions
Exam 23: Income Inequality, Poverty, and Discrimination324 Questions
Exam 24: Health Care280 Questions
Exam 25: Immigration259 Questions
Exam 26: International Trade347 Questions
Exam 27: The Balance of Payments, Exchange Rates, and Trade Deficits318 Questions
Exam 28: The Economics of Developing Countries277 Questions
Select questions type
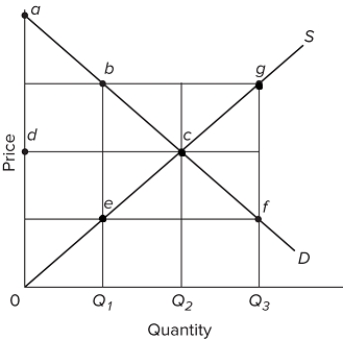 Refer to the provided graph of a competitive market. If the output level is Q₁, then there are efficiency losses indicated by the area
(Multiple Choice)
4.9/5  (39)
(39)
Insurance co-pays and deductibles are methods used by insurance companies to reduce moral hazard.
(True/False)
4.9/5 (33)
If pollution coming from factories is bad, then why would the socially optimal level of pollution not be zero?
(Multiple Choice)
4.7/5 (30)
People with high opportunity costs for time won't mind sitting in traffic.
(True/False)
4.9/5 (32)
A competitive market produces the economically efficient outcome if the following conditions are met, except
(Multiple Choice)
4.9/5 (40)
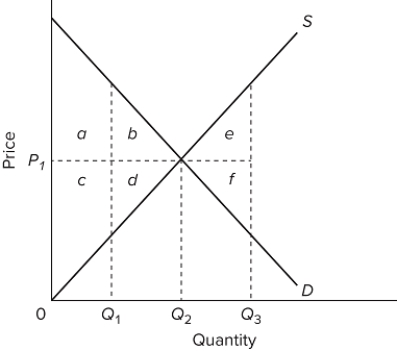 Refer to the diagram. If actual production and consumption occur at Q1,
(Multiple Choice)
4.7/5 (27)
If the production of a product or service involves external benefits, then the government can improve efficiency in the market by
(Multiple Choice)
4.8/5 (25)
As it applies to insurance, the adverse selection problem is the tendency for
(Multiple Choice)
4.9/5 (29)
Depositors do not check their banks carefully for stability anymore, because of the federal deposit insurance program. This illustrates the problem of
(Multiple Choice)
4.8/5 (45)
One consequence of the asymmetric-information problem in the used car market, if left unresolved, is the higher probability of
(Multiple Choice)
4.7/5 (31)
When there is allocative efficiency in a market, the buyers' maximum willingness to pay for the last unit traded is equal to the sellers' minimum acceptable price for that unit.
(True/False)
4.8/5 (31)
The franchising of fast-food restaurants would be an example of how a private business
(Multiple Choice)
4.9/5 (32)
Allocative efficiency occurs where the collective sum of consumer and producer surplus is at a maximum.
(True/False)
4.8/5 (31)
 Refer to the provided graph of a competitive market. If the output level is Q₂, then there will be
(Multiple Choice)
4.8/5 (32)
Where there are spillover (or external)benefits from having a particular product in a society, the government can make the quantity of the product approach the socially optimal level by doing the following, except
(Multiple Choice)
4.8/5 (37)
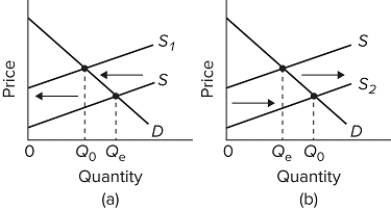 Refer to the diagrams for two separate product markets. Assume that society's optimal level of output in each market is Q₀ and that government purposely shifts the market supply curve from S to S₁ in diagram (a)on the left and from S to S₂ in diagram (b)on the right. We can conclude that the government is correcting for
(Multiple Choice)
4.9/5 (30)
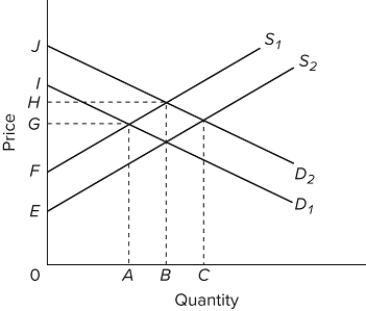 Refer to the provided supply and demand graph. S₁ and D₁ represent the current market supply and demand, respectively. S₂ and D₂ represent the socially optimal supply and demand. One way that the government could shift demand to its socially optimal level is to
(Multiple Choice)
4.9/5 (38)
Filters
- Essay(0)
- Multiple Choice(0)
- Short Answer(0)
- True False(0)
- Matching(0)